Dashboards
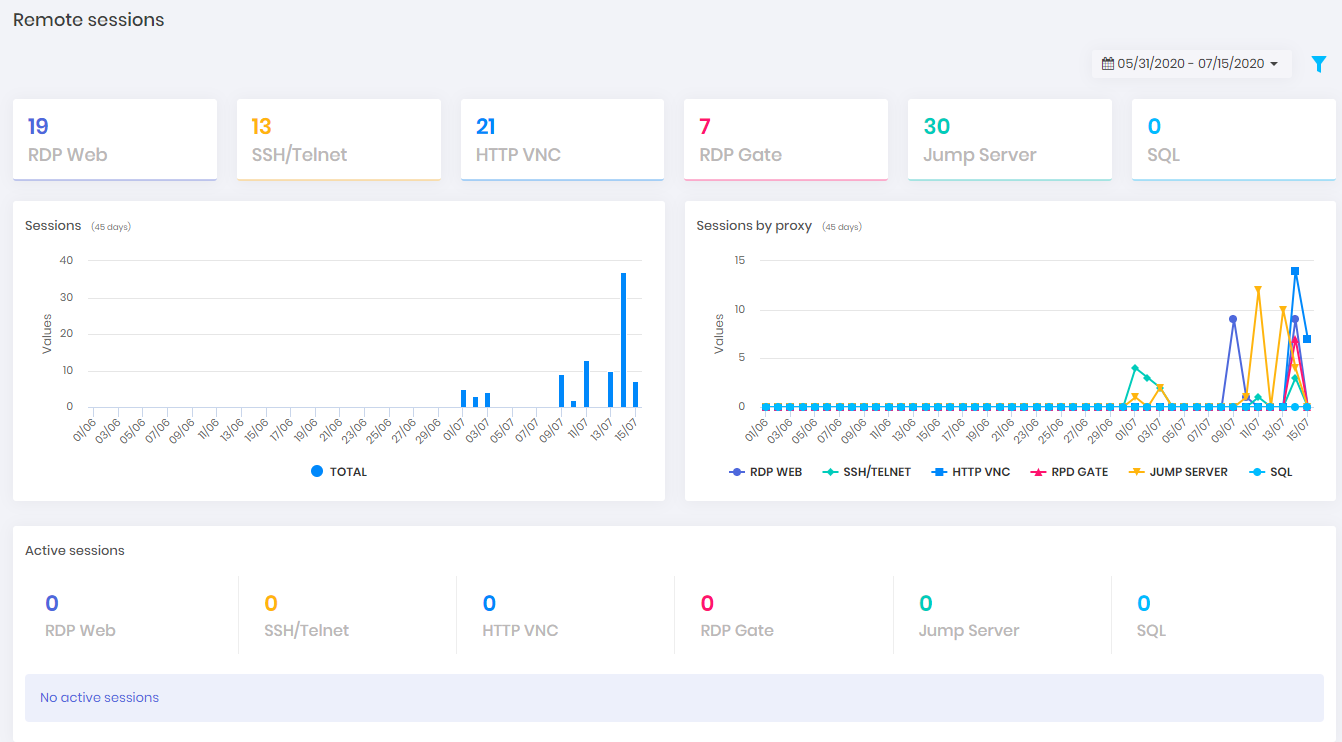
Through the Dashboard ➔ PAM Core ➔ Remote sessions menu, you will see the proxy technologies usage.

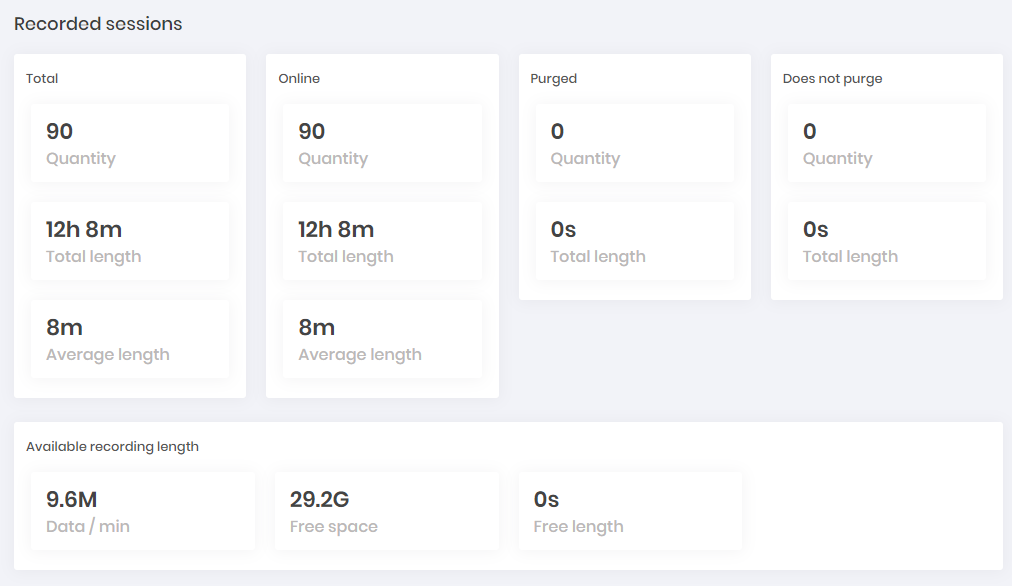
The Saved dashboard displays some numbers about how disk consumption is running, based on saved sessions. As well as how many session hours have already been audited.

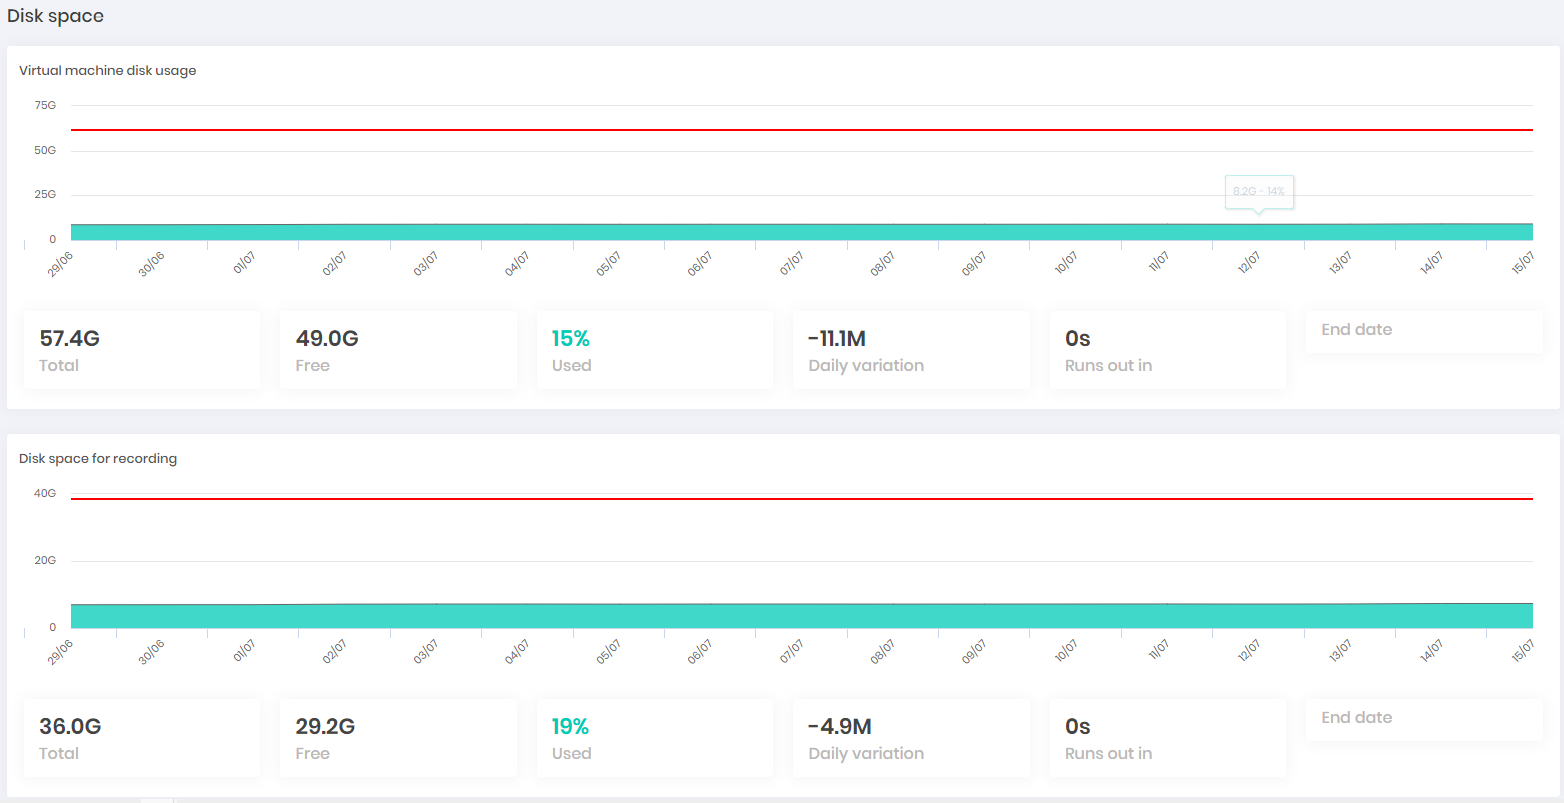
The Disk space dashboard displays disk consumption in a graphical view. These numbers can be monitored under SNMP.

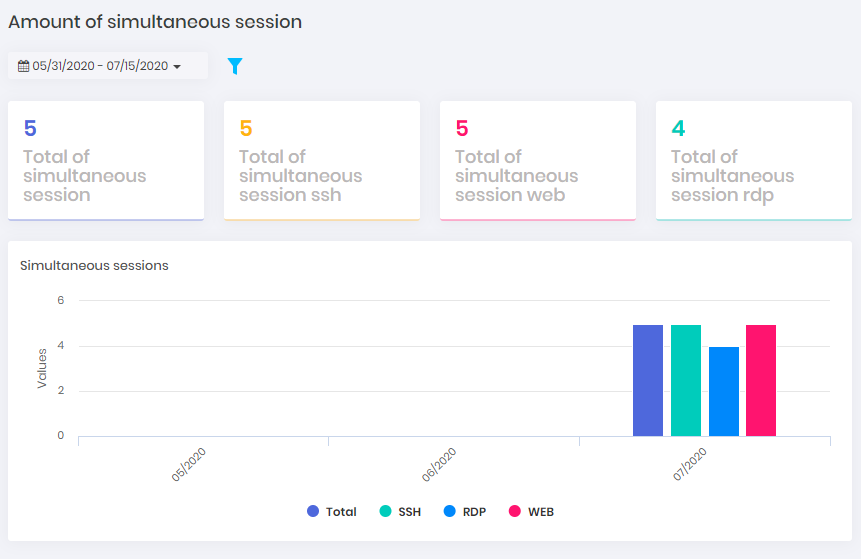
To obtain a concurrent resource consumption view, see the dashboards available at the System consumption menu. The dashboard below shows the simultaneous consumption of proxy sessions.
