CI/CD Variables Dashboard
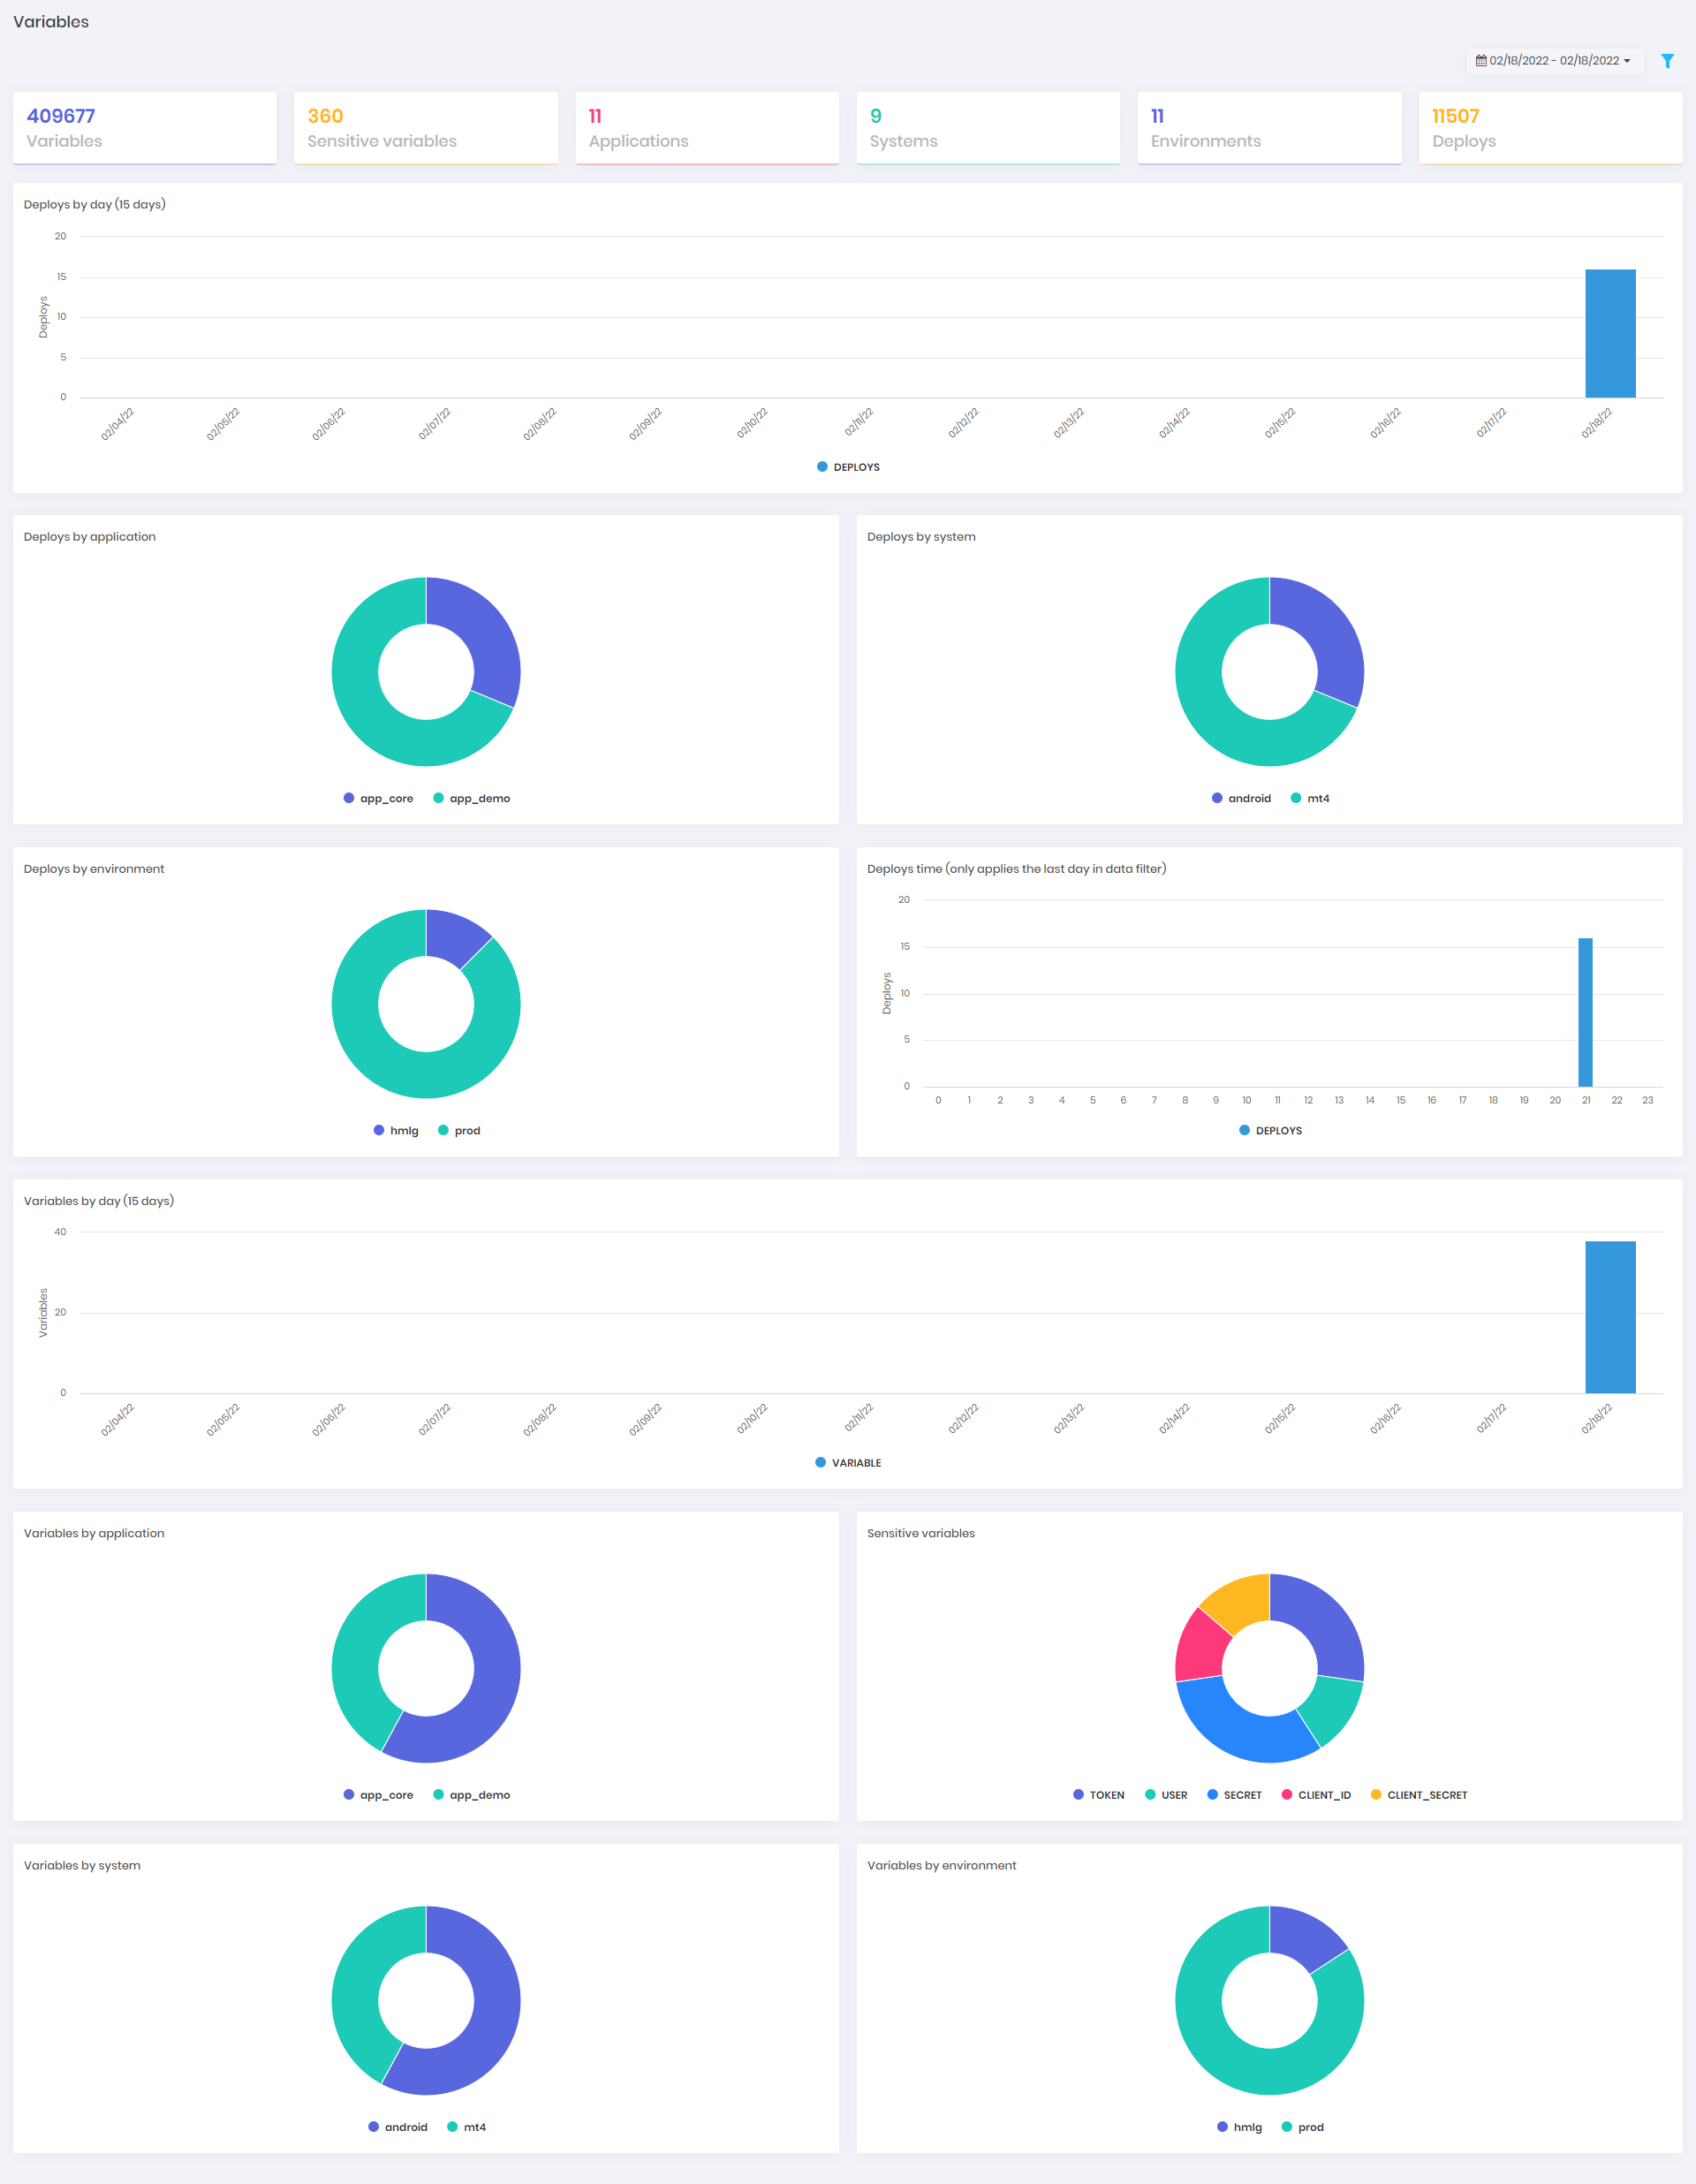
The CI/CD variables dashboard displays information about variables used in pipelines that senhasegura DSM was able to discover.
Access this dashboard in DevOps Secret Manager ➔ Dashboards ➔ CI/CD variables.
The following information is available in this dashboard:
| Information | Description |
|---|---|
| Variables | Total amount discovered of variables. |
| Sensitive variables | Total amount of variables with sensitive information, where senhasegura DSM can detect sensitive information based on varible names such as TOKEN, USER, PASSWORD, ACCESS_KEY_ID, SECRET_ACCESS_KEY, SECRET, CLIENT_ID and CLIENT_SECRET. |
| Applications | Total amount of applications related to discovered variables. |
| Systems | Total amount of systems related to discovered variables. |
| Environments | Total amount of environments related to discovered variables. |
| Deploys | Total amount of deployments. Everytime senhasegura DSM detects the senhasegura CLI execution it will register it as a Deploy. |
| Deploys by day (15 days) | A bar chart with the total amount of deployments registered in the last 15 days categorized by day. |
| Deploys by application | A pie chart with the total amount of deployments registered between a given date range according to the applied filter categorized by application. |
| Deploys by system | A pie chart with the total amount of deployments registered between a given date range according to the applied filter categorized by system. |
| Deploys by environment | A pie chart with the total amount of deployments registered between a given date range according to the applied filter categorized by environment. |
| Deploys time (only applies the last day in data filter) | A pie chart with the total amount of deployments registered between a given date range according to the applied filter categorized by hour of the day. This chart uses data colected in the last day of the data filter. |
| Variables by day (15 days) | A bar chart with the total amount of variables discovered in the last 15 days categorized by day. |
| Variables by application | A pie chart with the total amount of variables registered between a given date range according to the applied filter categorized by application. |
| Sensitive variables | A bar chart with the total amount of sensitive variables registered between a given date range according to the applied filter categorized by name. The detection of those variables is made by their names, where senhasegura DSM detect names such as TOKEN, USER, PASSWORD, ACCESS_KEY_ID, SECRET_ACCESS_KEY, SECRET, CLIENT_ID and CLIENT_SECRET. |
| Variables by system | A pie chart with the total amount of variables registered between a given date range according to the applied filter categorized by system. |
| Variables by environment | A pie chart with the total amount of variables registered between a given date range according to the applied filter categorized by environment. |
More Detailed Reports
It is possible to access more details of a given report just by clicking on it using a drill-down navegation format.
Filterable Information
Some information can be filtered by data ranges, such as:
- Deploys by application
- Deploys by system
- Deploys by environment
- Deploys time (only applies the last day in data filter)
- Variables by application
- Sensitive variables
- Variables by system
- Variables by environment