CI/CD variables
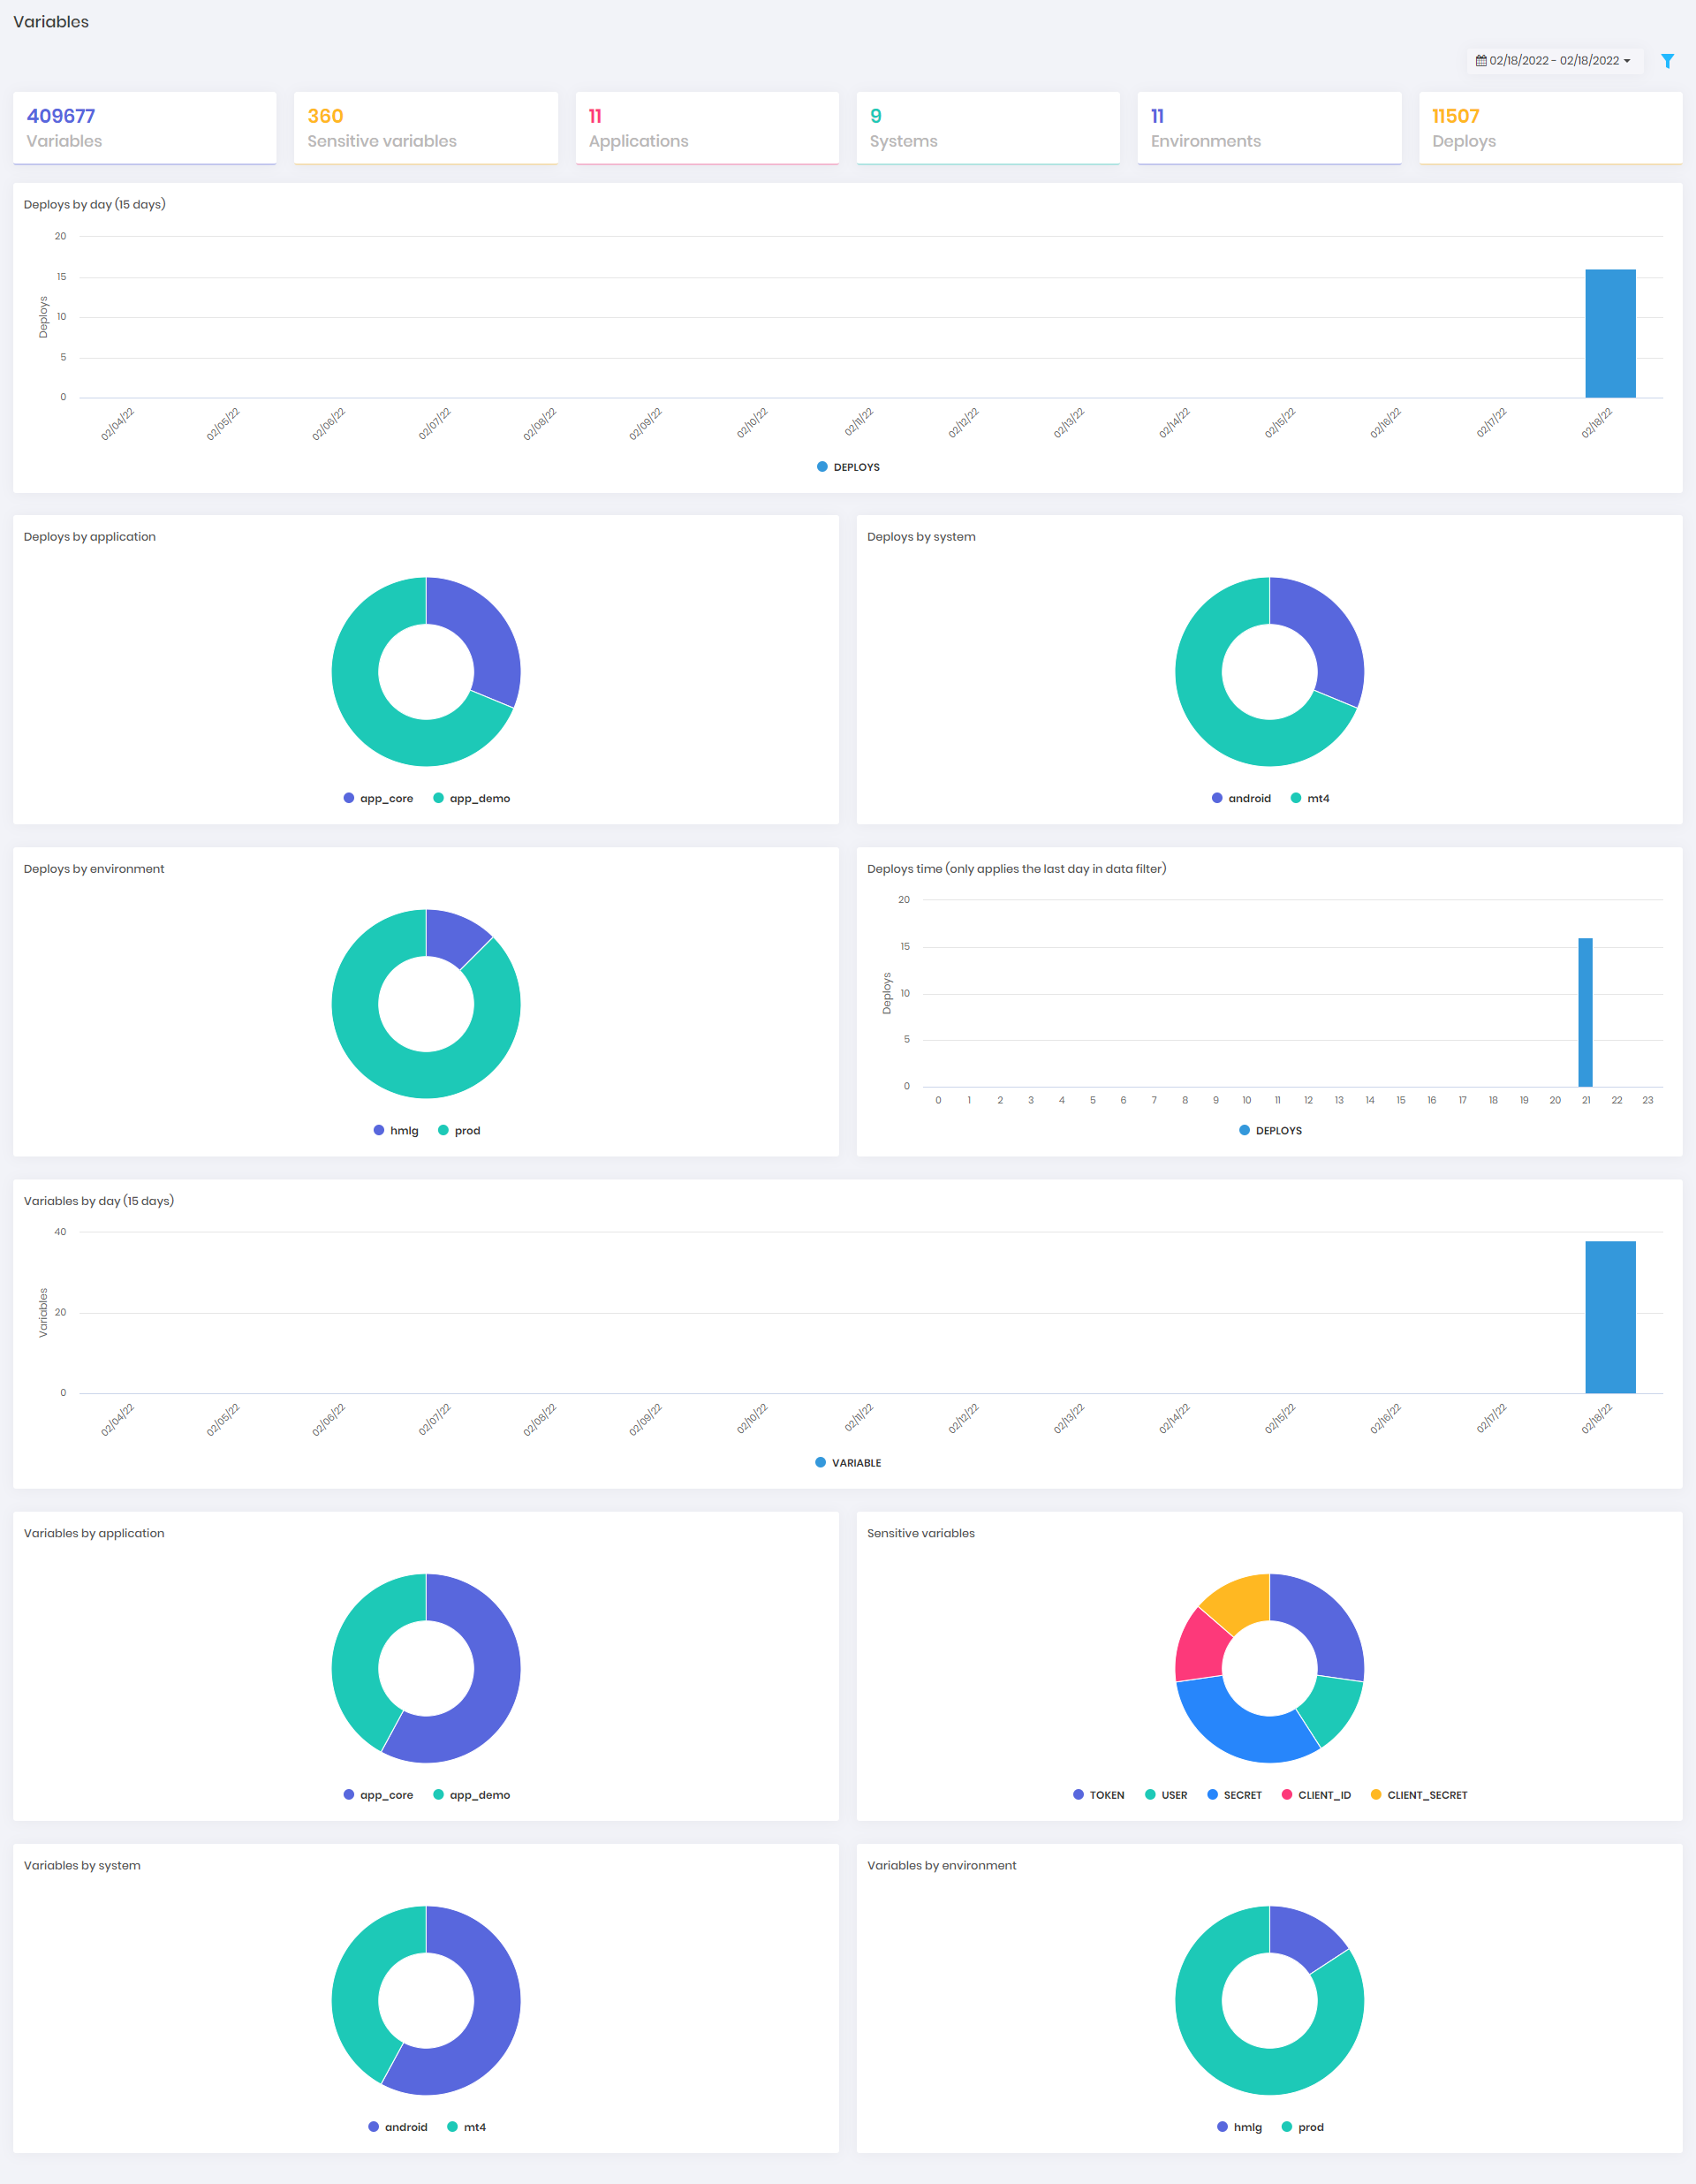
This dashboard shows the number of variables, the number of variables with sensitive data, applications, deployments, etc.
You can filter some information by data interval.
Access this dashboard in DSM ➔ Dashboards ➔ CI/CD variables.
The following information is available in this dashboard:
| Information | Description |
|---|---|
| Variables | Total of variables. This information is not affected by data filter. |
| Sensitive variables | Total of variables with sensitive information. Variables that has the follow words in the name: - token - password - user - secret_access_key - access_key_id - username - secret - client_id - client_secret. This information is not affected by data filter. |
| Applications | Total of applications related to the variables. This information is not affected by data filter. |
| Systems | Total of systems related to the applications. This information is not affected by data filter. |
| Environments | Total of environments related to the applications. This information is not affected by data filter. |
| Deploys | Total of deployments. This information is not affected by data filter. |
| Deploys by day (15 days) | A bar chart with the numbers of the deployments made in the last 15 days. This chart is not affected by data filter. |
| Deploys by application | A pie chart with the number of the deployments by application. This chart is affected by data filter. |
| Deploys by system | A pie chart with the number of the deployments by system. This chart is affected by data filter. |
| Deploys by environment | A pie chart with the number of the deployments by environment. This chart is affected by data filter. |
| Deploys time (only applies the last day in data filter) | A pie chart with the number of the deployments by hour of the day. This chart uses data colected in the last day of the data filter. For example: if the data filter is 02/18/2021 until 02/18/2022, this chart will use the data 02/18/2022. This chart is affected by data filter. |
| Variables by day (15 days) | A bar chart with the numbers of the variables collected in the last 15 days. This chart is not affected by data filter. |
| Variables by application | A pie chart with the number of the variables by application. This chart is affected by data filter. |
| Sensitive variables | A bar chart with the numbers of the collected sensitive variables by name. This chart is affected by data filter. |
| Variables by system | A pie chart with the number of the variables by system. This chart is affected by data filter. |
| Variables by environment | A pie chart with the number of the variables by environment. This chart is affected by data filter. |
tip
You can click on the boxes or charts to open the filtered report.