Dashboards
An easy way to obtain information about the integrity and use of the system is through the Dashboards section. Some dashboards can be accessed from a user without permission to access and use credentials. In this way, you can create a generic user that can be on display for your security team monitoring. These dashboards are marked as "Showcase" in this documentation.
Access the dashboard through the menu Dashboard.
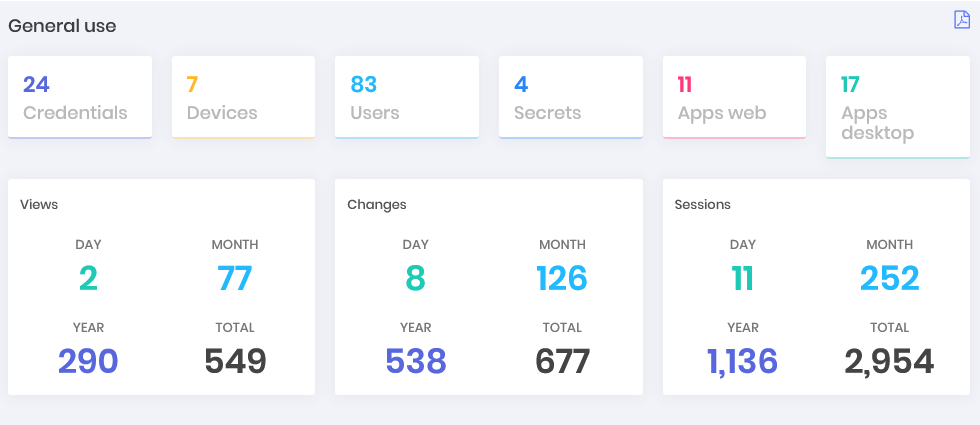
- General use: Follow the growth of credential records, devices, users, secrets, web clients and workstations managed by senhasegura . Also have visibility on how many queries, password changes and proxies sessions are being performed throughout the day, month, year and its total.
PAM Core
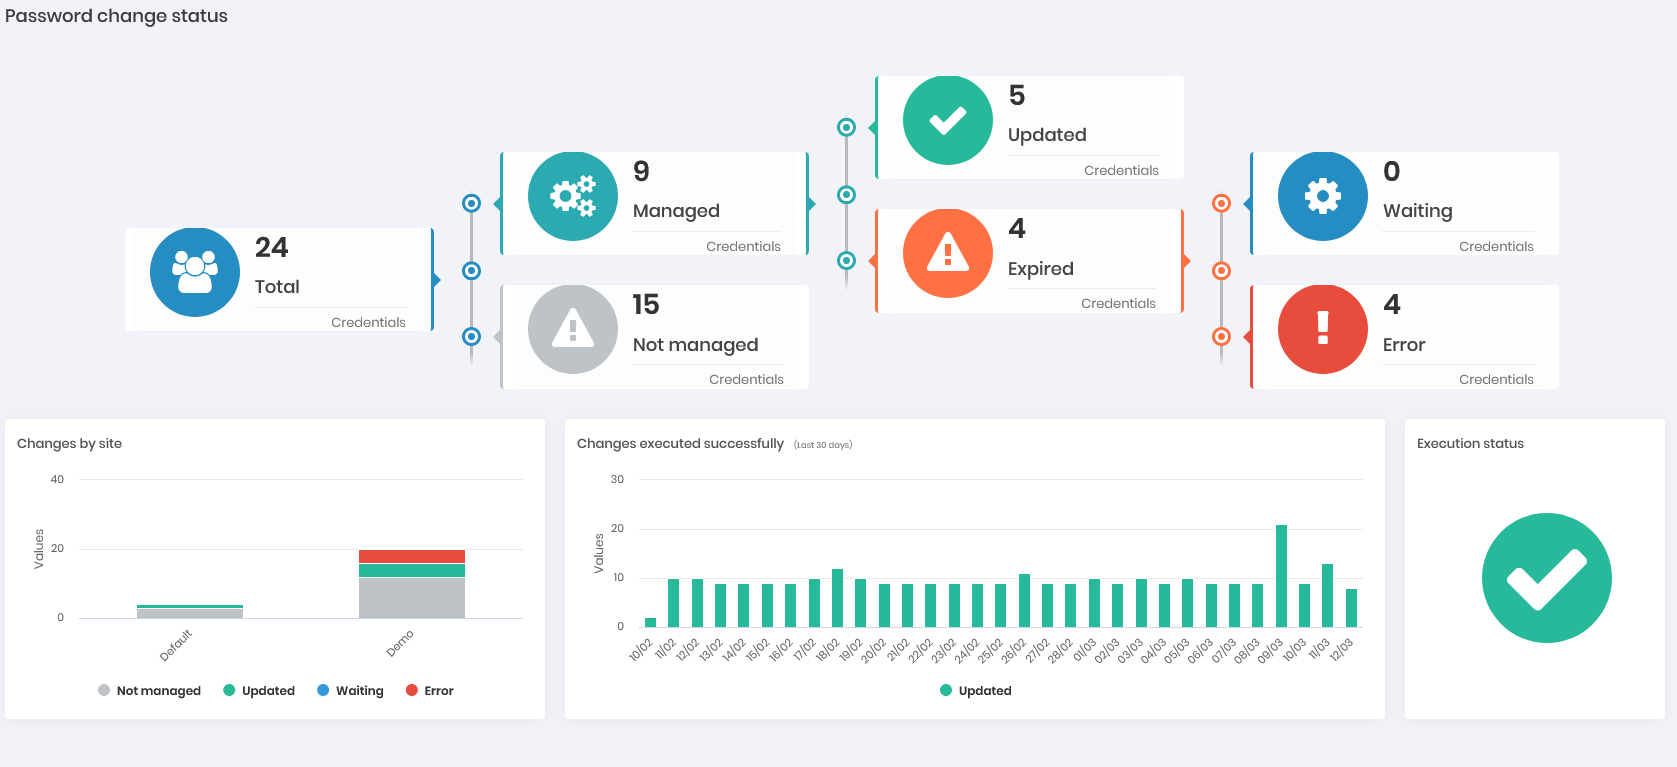
- Password changes: Get visibility on how many credentials are managed by senhasegura and how many are configured with automatic password change and how many are not yet. Within the configured ones, how many are updated and how many have expired, as well as how many are waiting for the execution and how many had an execution error. With these data, see a segregation of these numbers by site and a graph showing the evolution of the exchanges that have occurred successfully over the days. (Can be displayed in Showcase)
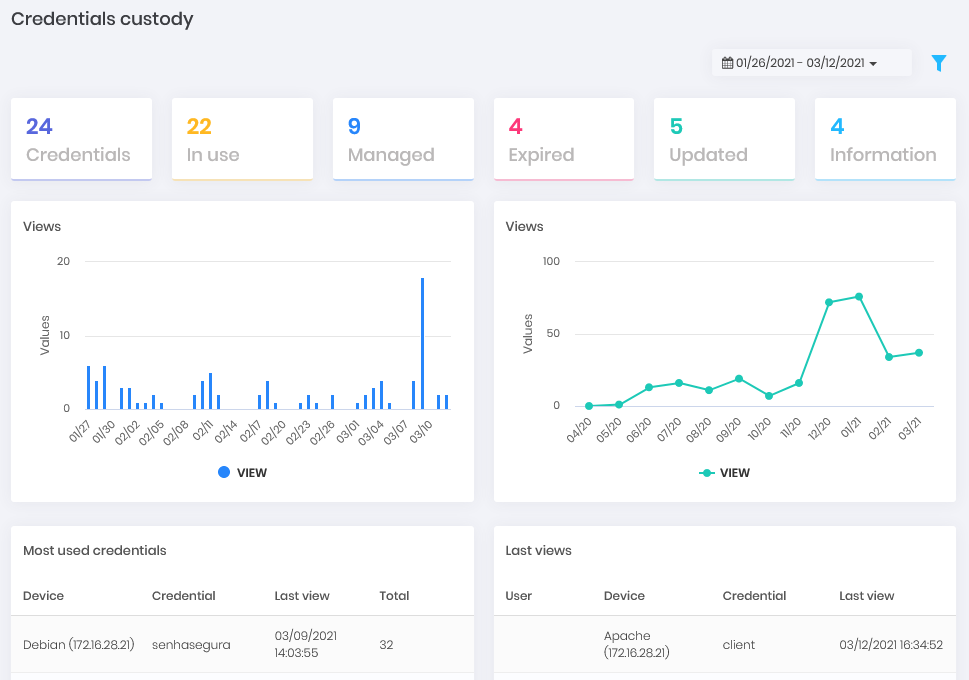
- Custody: In numbers and graphs, how many credentials managed by senhasegura are in use and the number of views per day. See also which credentials are in custody, which are the recent views and which are the most used.
Radar: In a sonar view, what are the proxy sessions that take place today and in the last 6 hours of the previous day. The proximity of the center is given by the minutes of login, where the smaller, the closer to the center you are. The peripheral division occurs by the time of occurrence. The colors vary according to the criticality of punctuation by the events of the session. The interactivity in the elements allows a drill down of the information.
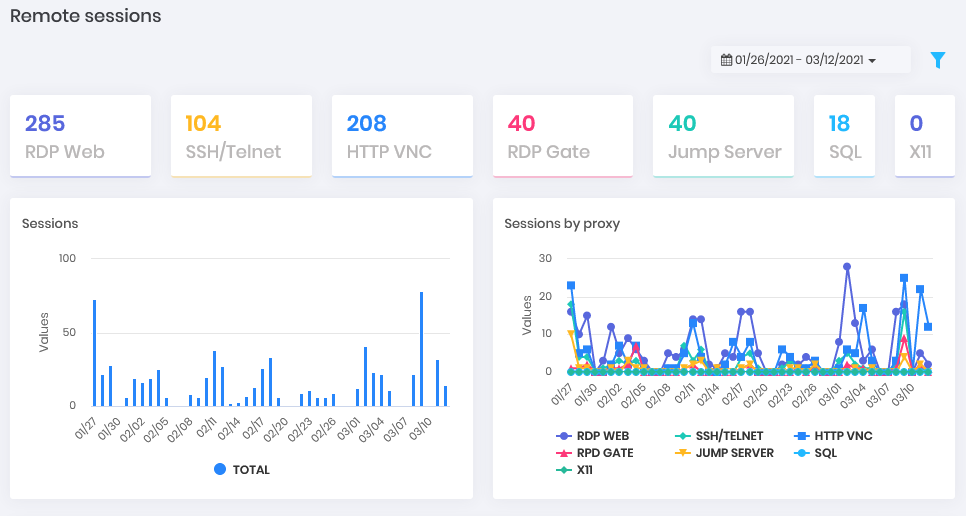
Remote sessions: How many remote sessions took place within the various protocols served by the platform. Have a graphical view of the distribution by days and protocol. Active sessions are also broken down. (Can be displayed in Showcase)
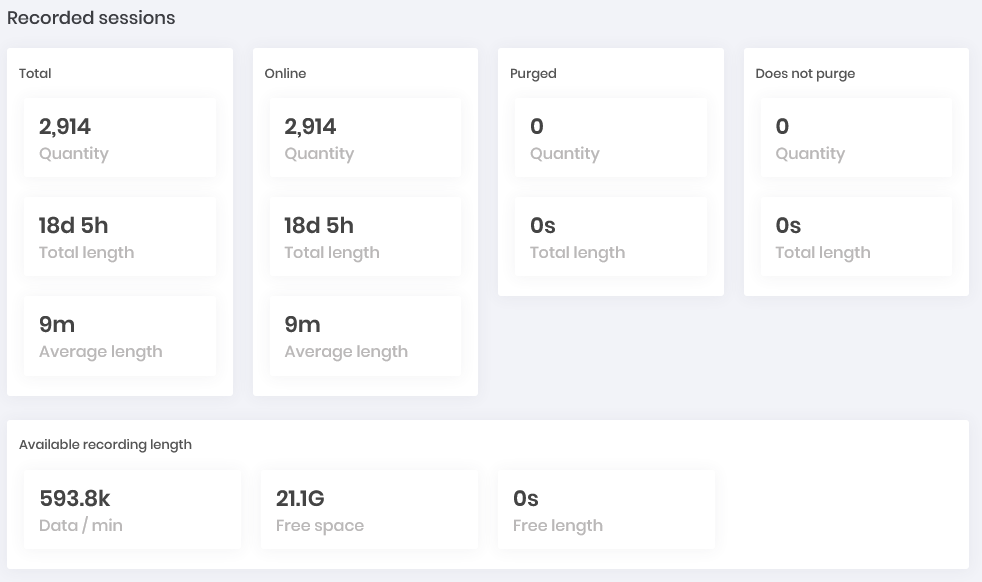
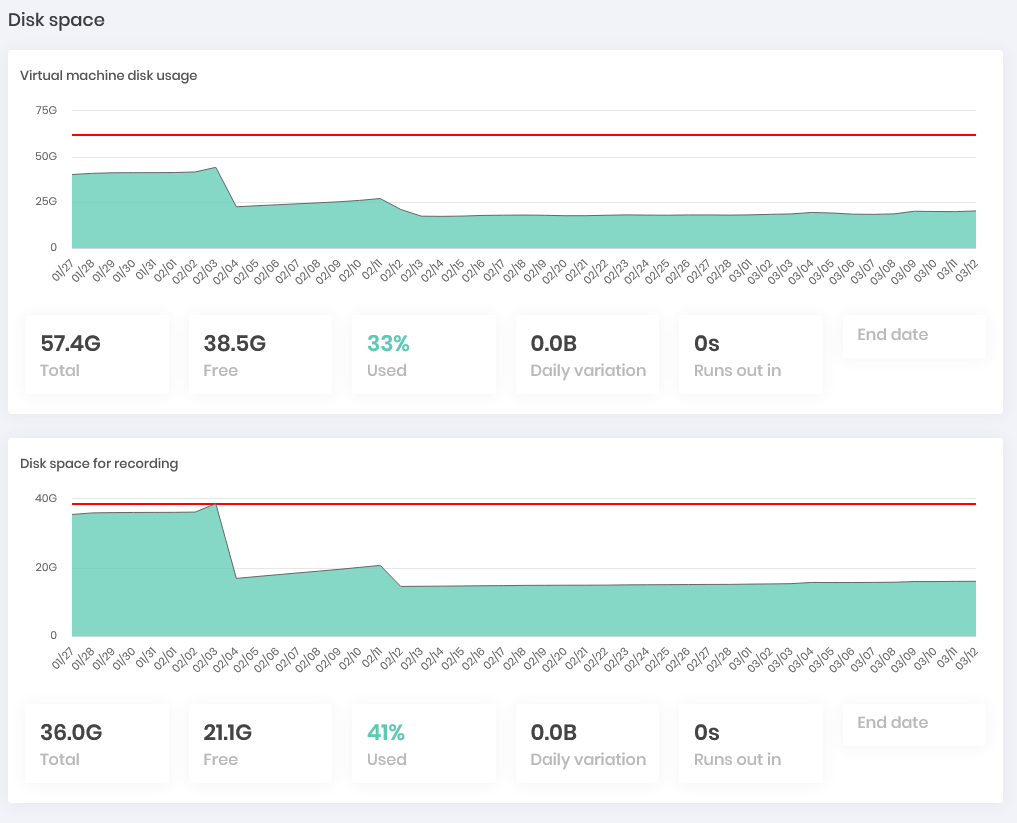
- Saved: How many sessions are physically persisted in senhasegura at the moment. How many were discarded by rotation and how many are marked not to be purged. Have this view by quantity, total duration and average duration. In the end, how much free space the platform counts to continue recording. (Can be displayed in Showcase)
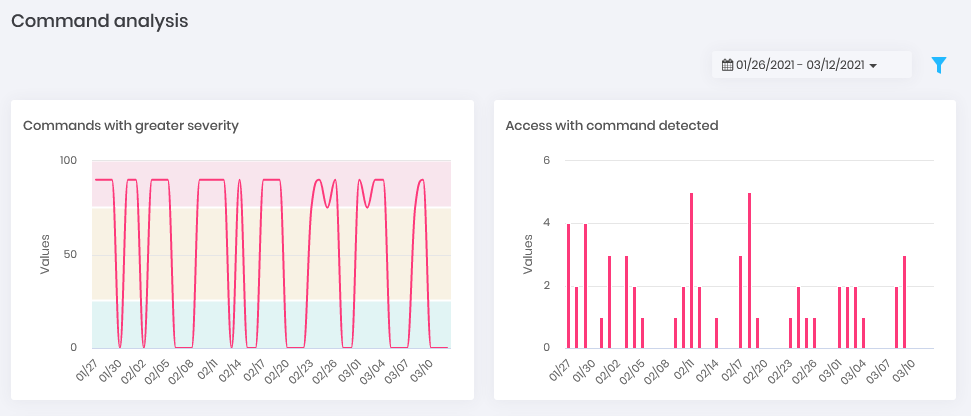
- Commands: Within SSH proxy sessions, how many sessions were scored with audited commands and what is the cumulative severity of the days. Who are the users with the highest index severity and which are the source IPs with the highest command record audited performed.
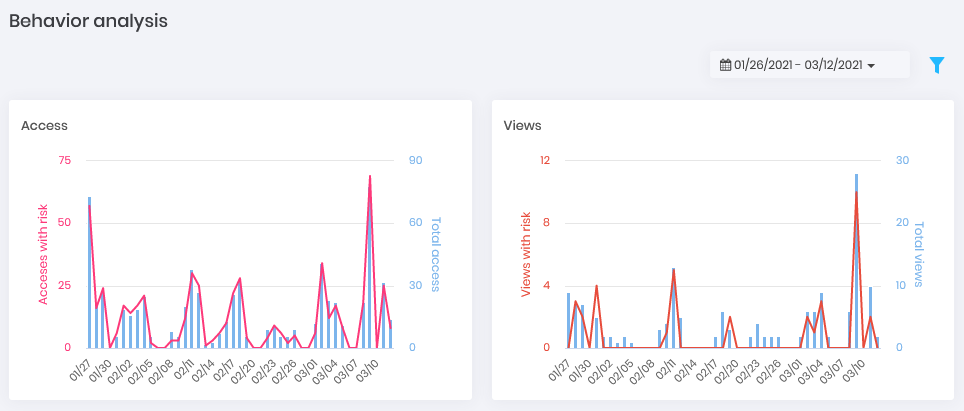
- Behavior: Given the behavior of the user in relation to the data that he usually accesses and within the times when this normally occurs, what are the events that go beyond the standard. Get this view by day charts and ranking of accesses and password withdrawals.
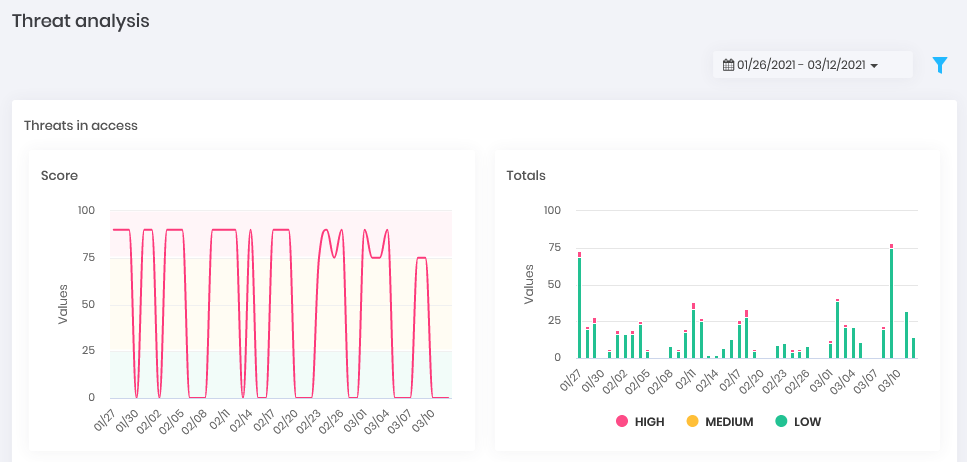
- Threats: Who are the users whose actions in accessing and withdrawing the password present the greatest risk to operations.
- Disk Space: Have an evolutionary view on the platform's disk consumption. (Can be displayed in Showcase)
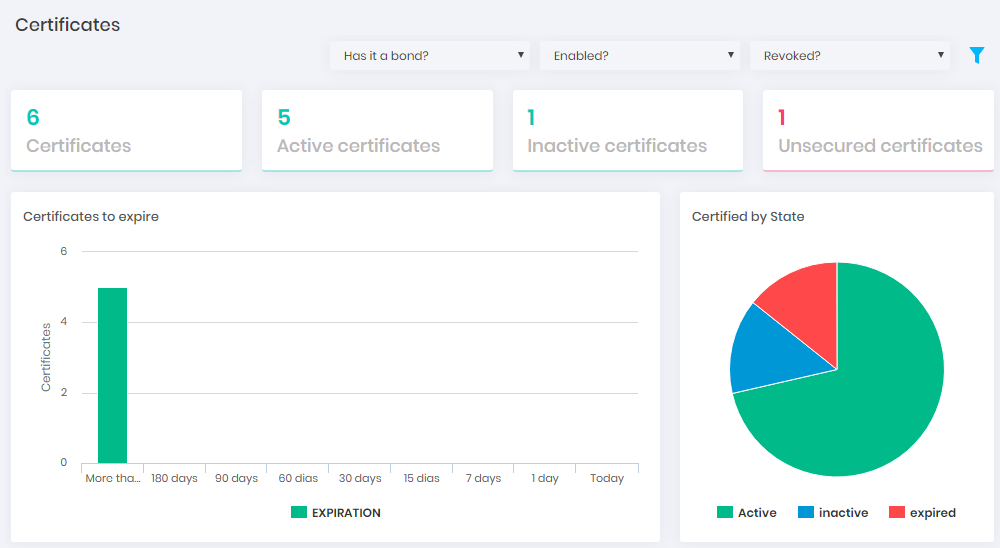
Certificate Manager
This dashboard shows you how many certificates are being managed by senhasegura, how many of these are active, inactive and how many of them are considered unsafe. Have a graphical view to identify how many of these certificates are close to expiring in intervals ranging from more than 180 days to the current day. Other graphics help you to see how the certificates are distributed by environment, systems, CA, types, key size and other relevant attributes.
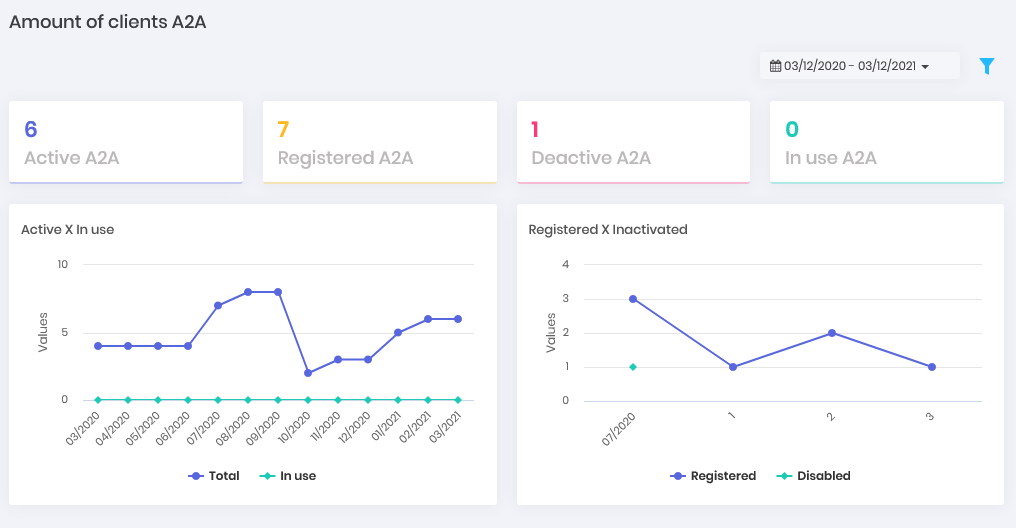
A2A
How many applications are using the platform to consume their managed data. Being segregated in how many are active and inactive, having a view of the evolution of use per day.
Task Manager
What is the success rate and error of execution of the tasks and how they are distributed by the environments and systems. What tasks are most performed and which target devices are most affected.
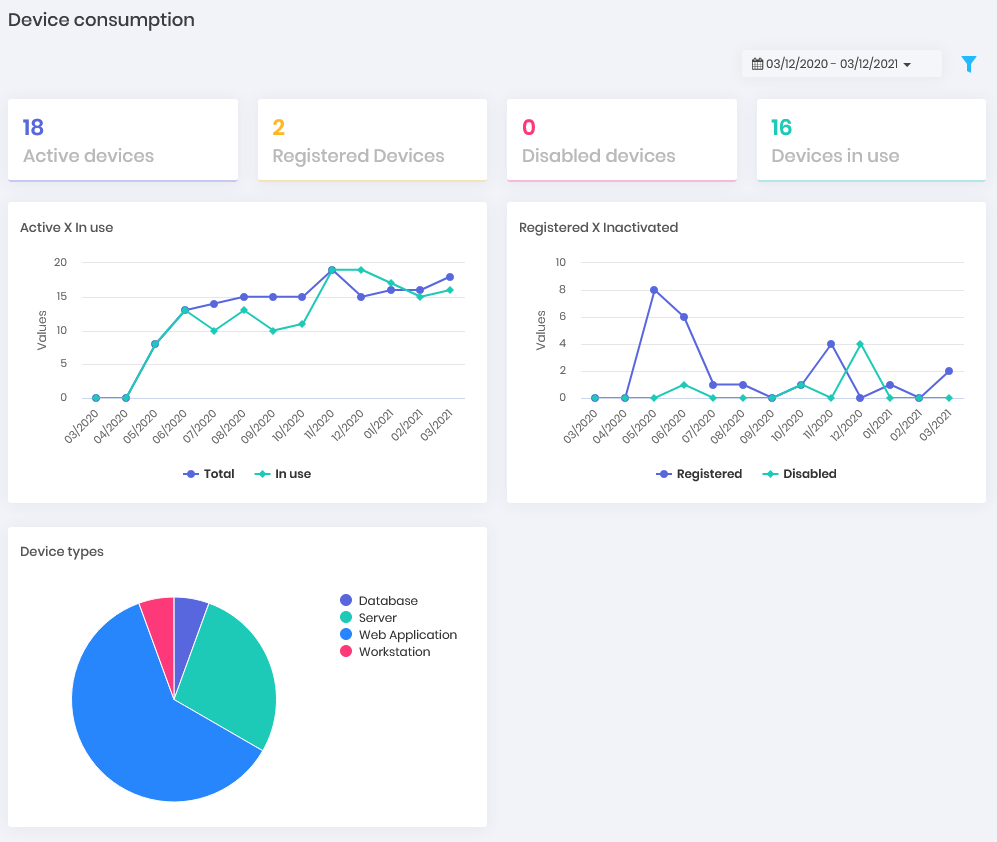
System consumption
- Devices: How many devices are registered in senhasegura and how many are active, inactive and in use. How the device types are distributed and the evolution between active and inactive within a timeline.
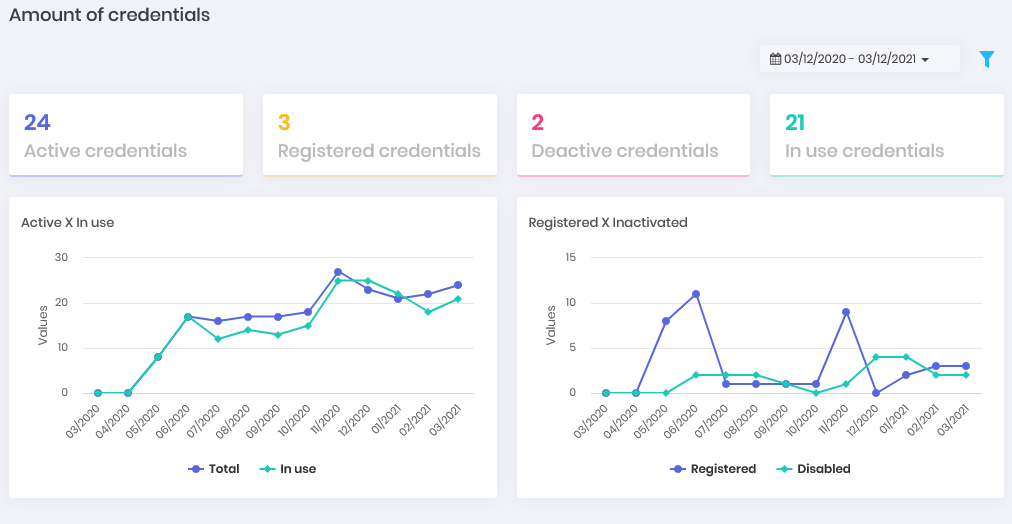
- Credentials: How many credentials are registered in senhasegura and how many of them are active, inactive and in use. How is the evolution between active and inactive within a timeline.
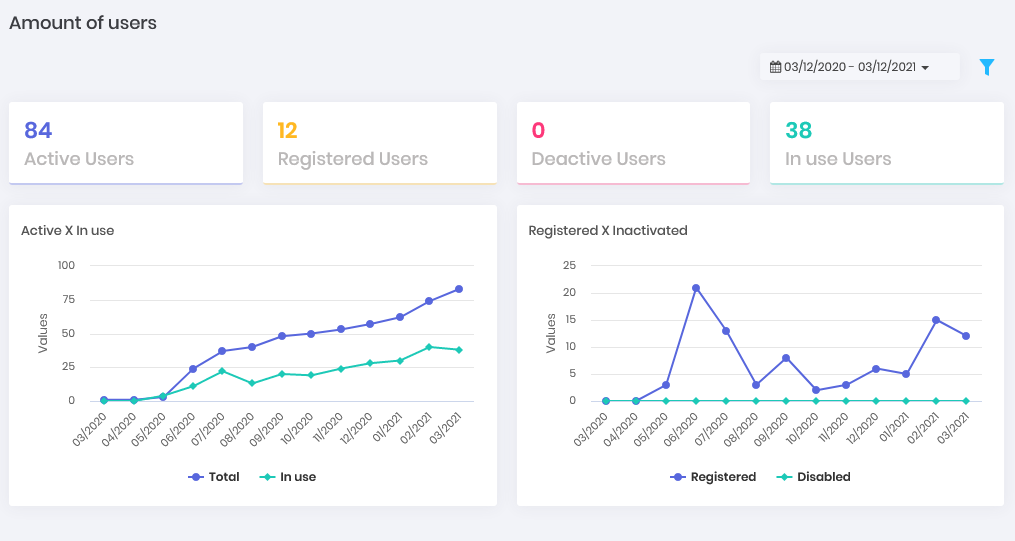
- Users: How many users are registered in senhasegura and how many of them are active, inactive and in use. How is the evolution between active and inactive within a timeline.
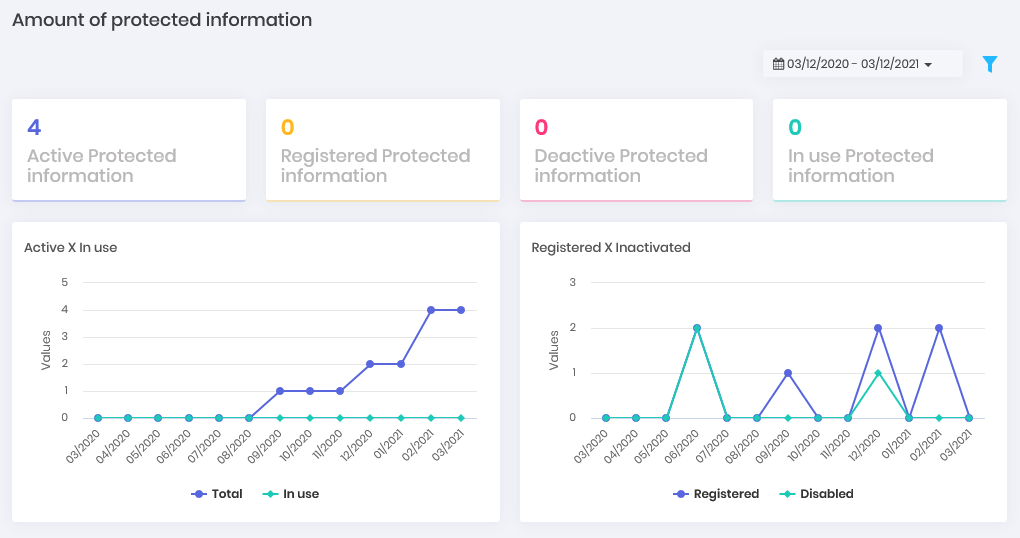
- Secrets: How many secrets are registered in senhasegura and how many of them are active, inactive and in use. How is the evolution between active and inactive within a timeline.
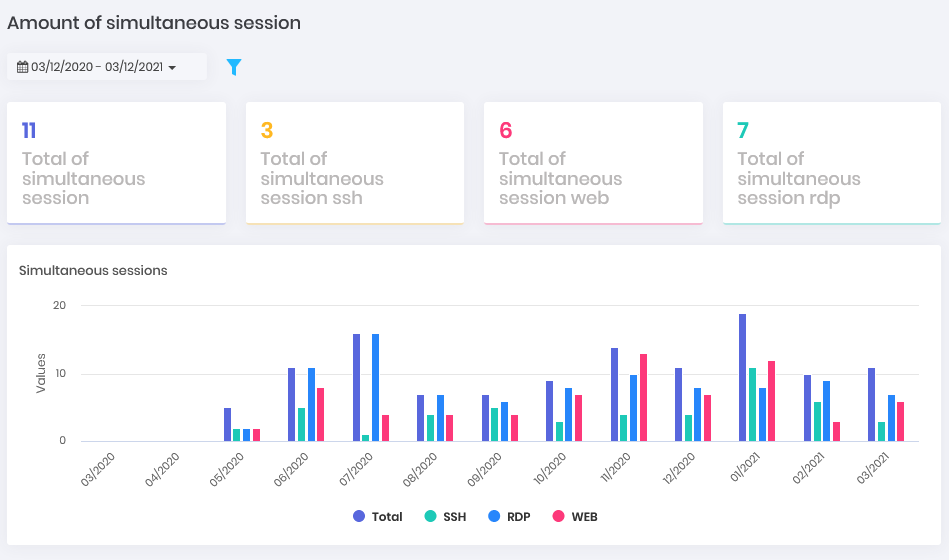
- Simultaneous: How many simultaneous proxy sessions take place on the platform and what type they are. (Can be displayed in Showcase)
General Consumption
In Dashboards ➔ General Consumption ➔ General
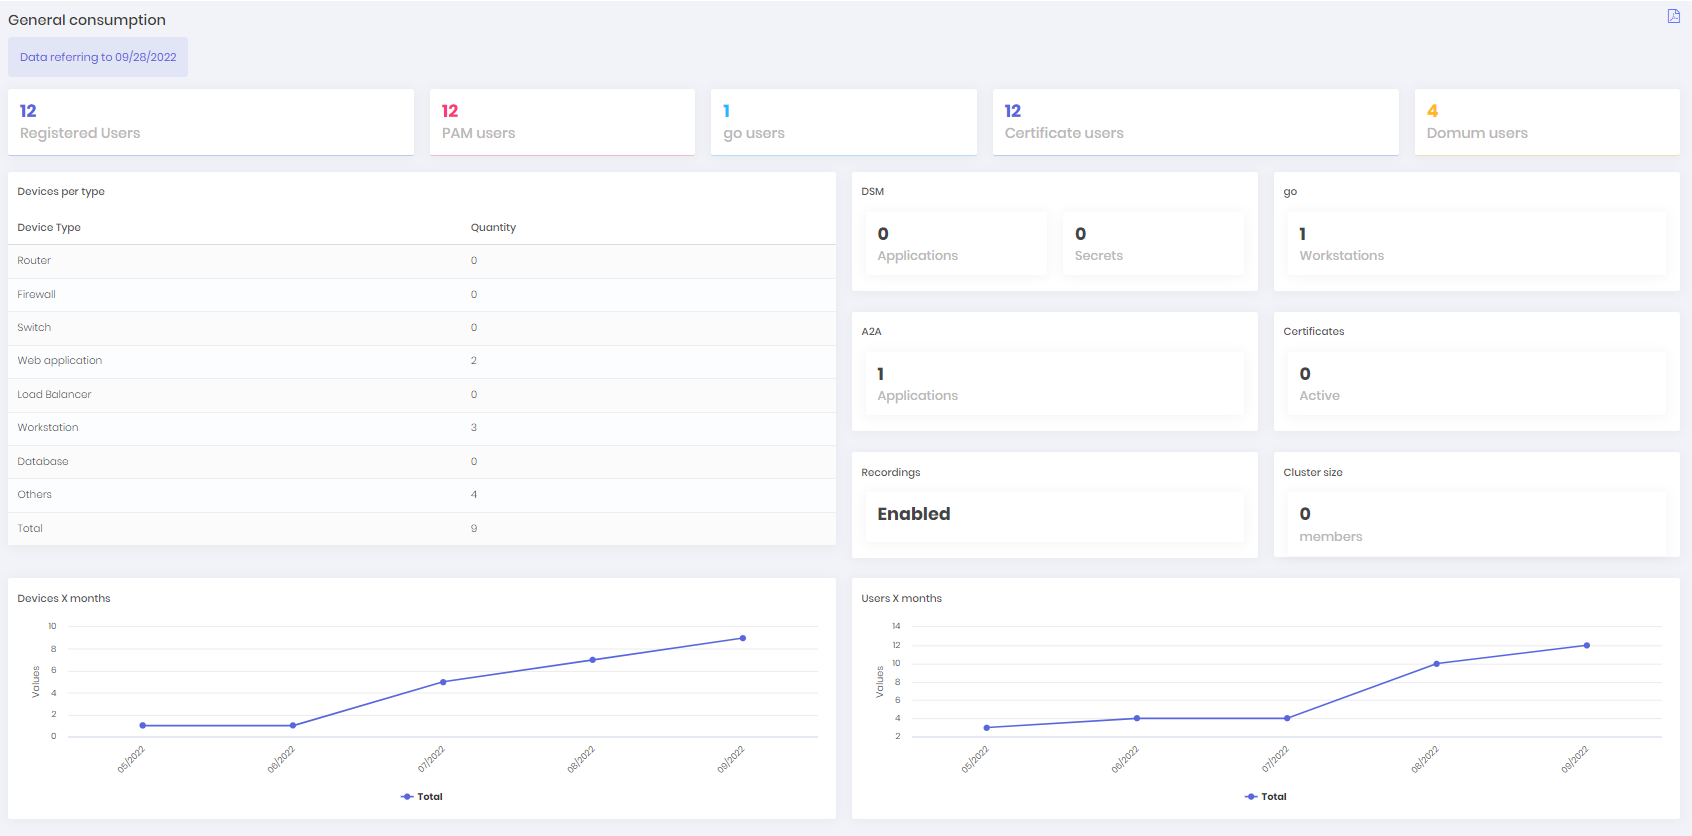
Shows the reference date of the general consumption report;
How many devices are registered in senhasegura system and how many users have access to the modules (PAM, GO, Domum and Certificates);
Quantity of devices filtered by type;
How many secrets and applications exists in DSM, and how many workstations exists in Go module;
How many applications exist in A2A;
How many active certificates exists;
If the recordings are active or not;
The cluster size;
How many devices and users were registered per month, being able to verify through a dashboard;
It is possible to generate a .pdf with the information displayed in the dashboard by clicking on the top-right icon.