Application Dashboard
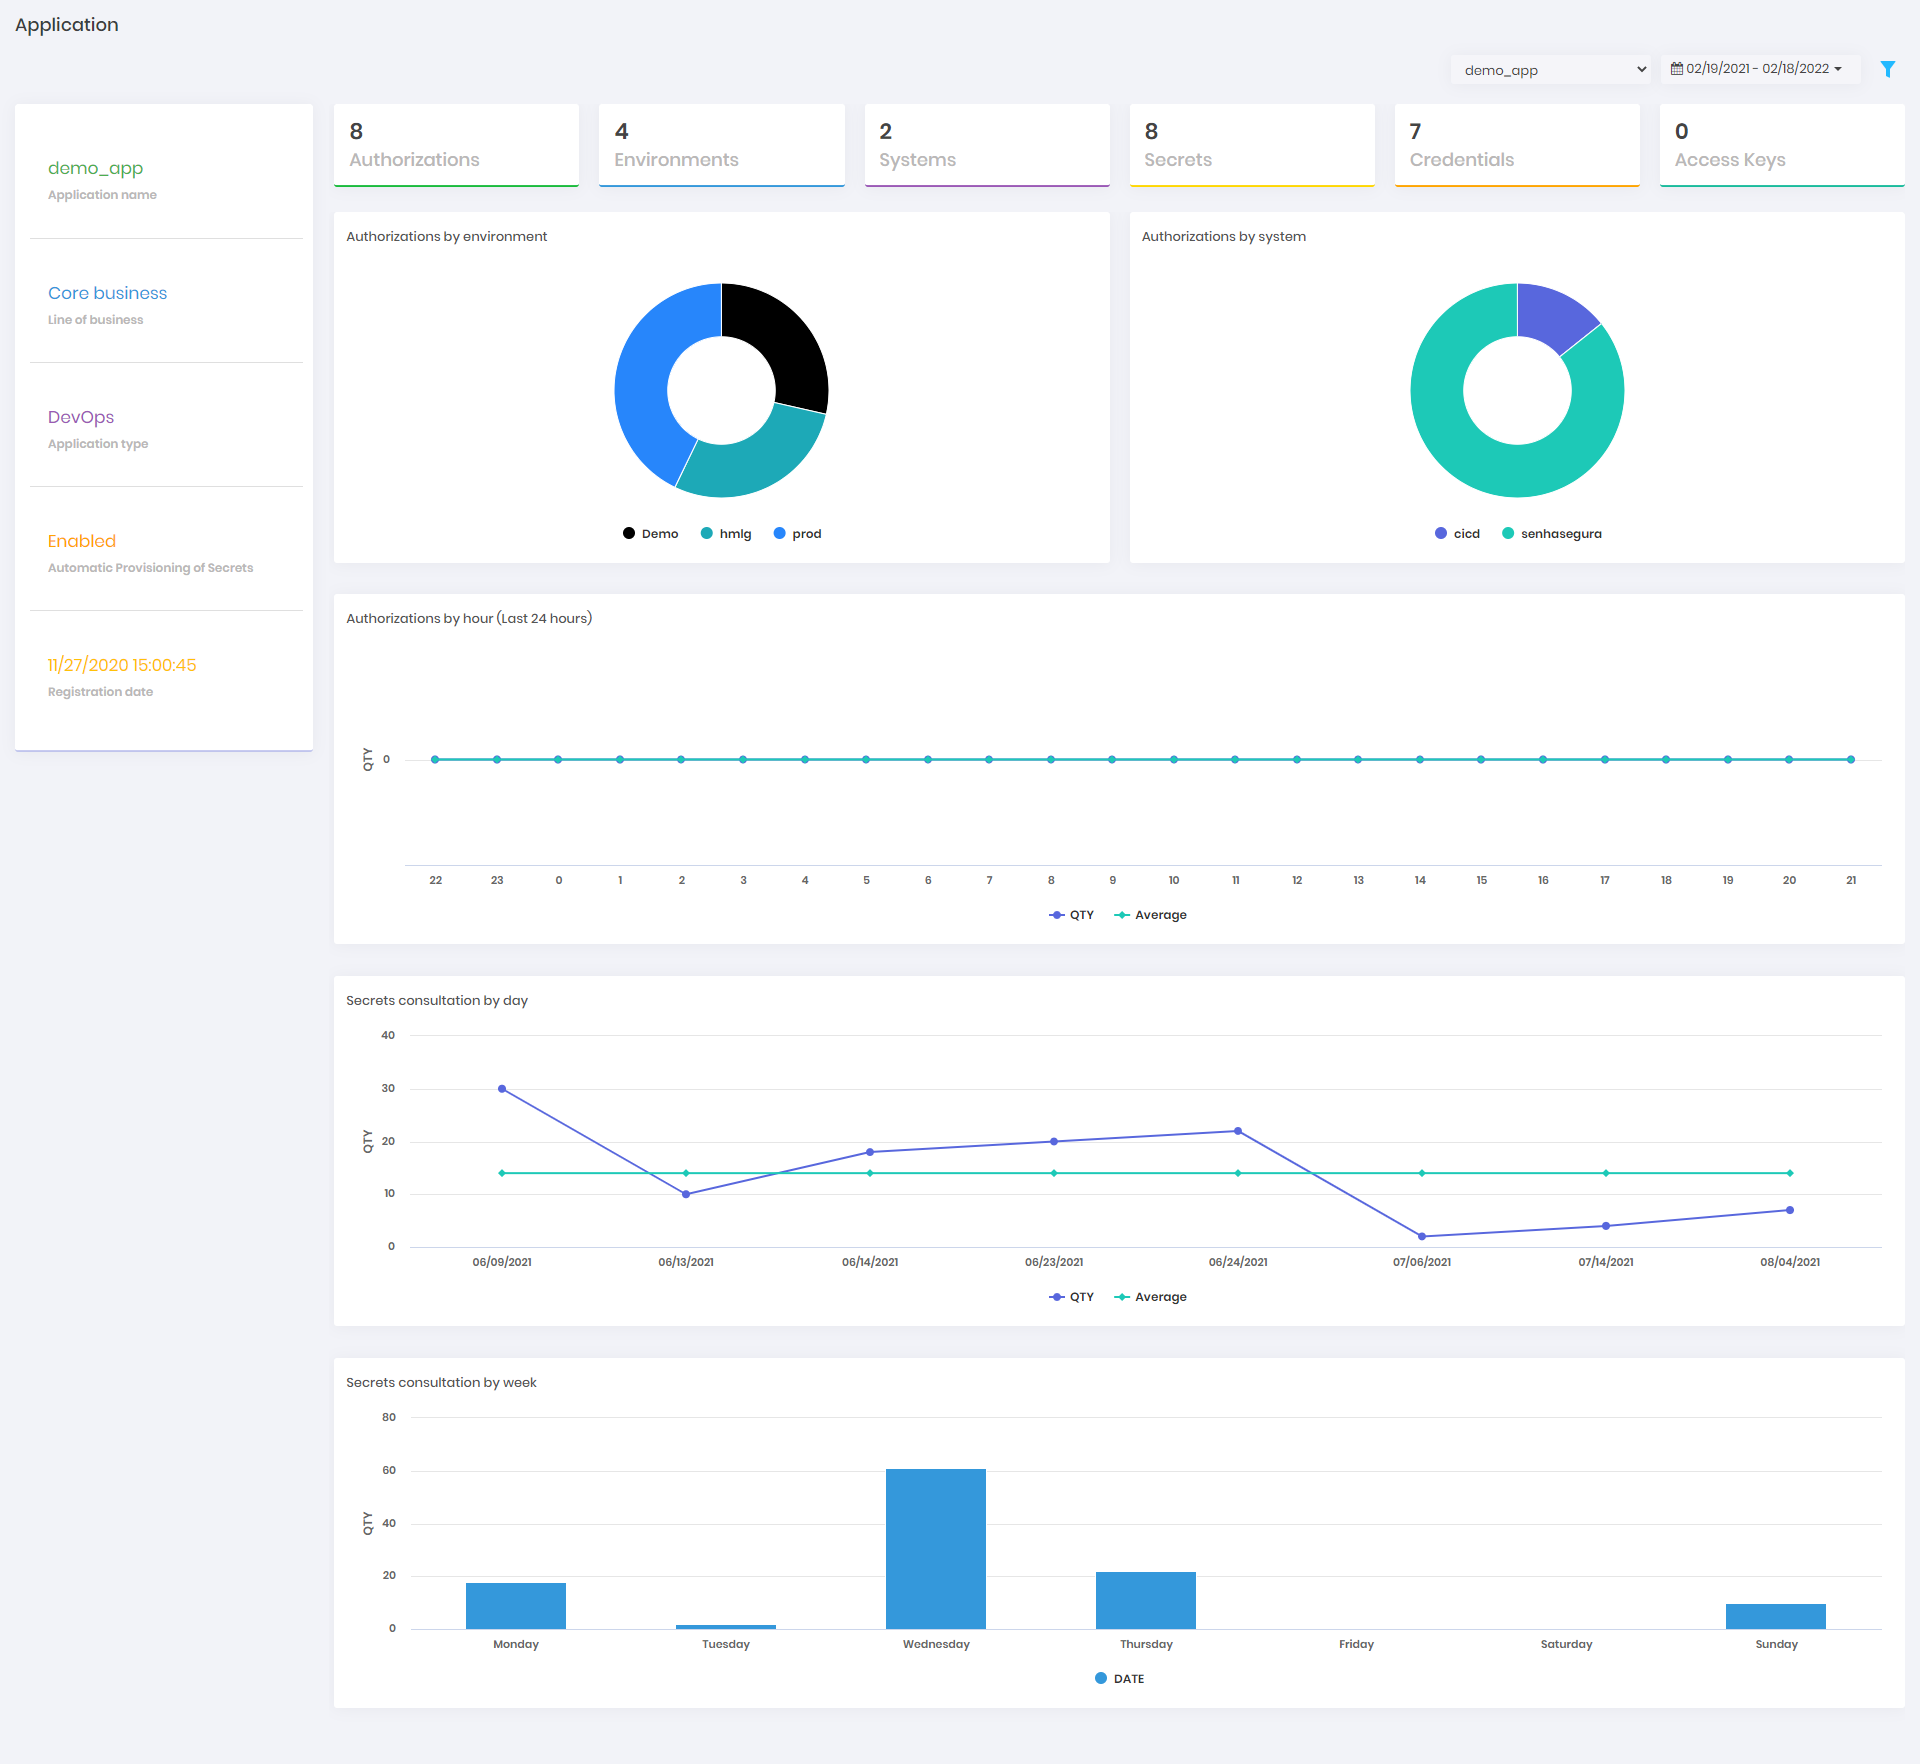
The Application dashboard displays information about specific applications managed by the senhasegura DSM.
Access this dashboard in DSM ➔ Dashboards ➔ Application.
The following information is available in this dashboard:
| Information | Description |
|---|---|
| Application name | The name of the application according to the applied filter. |
| Line of business | The appplication's configured Line of business according to the applied filter. |
| Application type | The application's configured Type according to the applied filter. |
| Automatic Provisioning of Secrets | Wether the application has Dynamic Provisioning enabled or not according to the applied filter. For more information, please check the Dynamic Provisioning guide. |
| Registration date | Date and time of the application creation in senhasegura DSM according to the applied filter. |
| Authorizations | Total amount of authorizations registered between a given date range and are currently enabled for the application according to the applied filter. |
| Environments | Total amount of enviornments registered between a given date range and are currently enabled that are related to the application according to the applied filter. |
| Systems | Total amount of systems registered between a given date range and are currently enabled that are related to the application according to the applied filter. |
| Secrets | Total amount of secrets registered between a given date range and are currently enabled that are related to the application according to the applied filter. |
| Credentials | Total amount of secrets with credentials registered between a given date range and are currently enabled that are related to the application according to the applied filter. |
| Access Keys | Total amount of secrets with cloud access keys registered between a given date range and are currently enabled that are related to the application according to the applied filter. |
| Authorizations by environment | A pie chart with the total amount of authorizations registered between a given date range that are related to the application according to the applied filter categorized by environment. |
| Authorizations by system | A pie chart with the total amount of authorizations registered between a given date range that are related to the application according to the applied filter categorized by system. |
| Authorizations by hour (Last 24 hours) | A bar chart with the total amount of authorizations registered per hour in the last 24 hours. |
| Secrets consultation by day | A line chart with the total amount of secrets requests in a given date range according to the applied filter categorized by day. |
| Secrets consultation by week | A bar chart with the total amount of secrets requests for the last week categorized by weekday. |

More Detailed Reports
It is possible to access more details of a given report just by clicking on it using a drill-down navegation format.
Filterable Information
All the displayed information can be filtered by application, but not all of them can be filtered by date ranges, being possible to filter information such as:
- Authorizations by environment
- Authorizations by system
- Secrets consultation by day