Application
The Application dashboard makes it possible to find information about a specific application managed by the solution.
You can filter some information by application or data interval.
Access this dashboard in DSM ➔ Dashboards ➔ Application.
The following information is available in this dashboard:
| Information | Description |
|---|---|
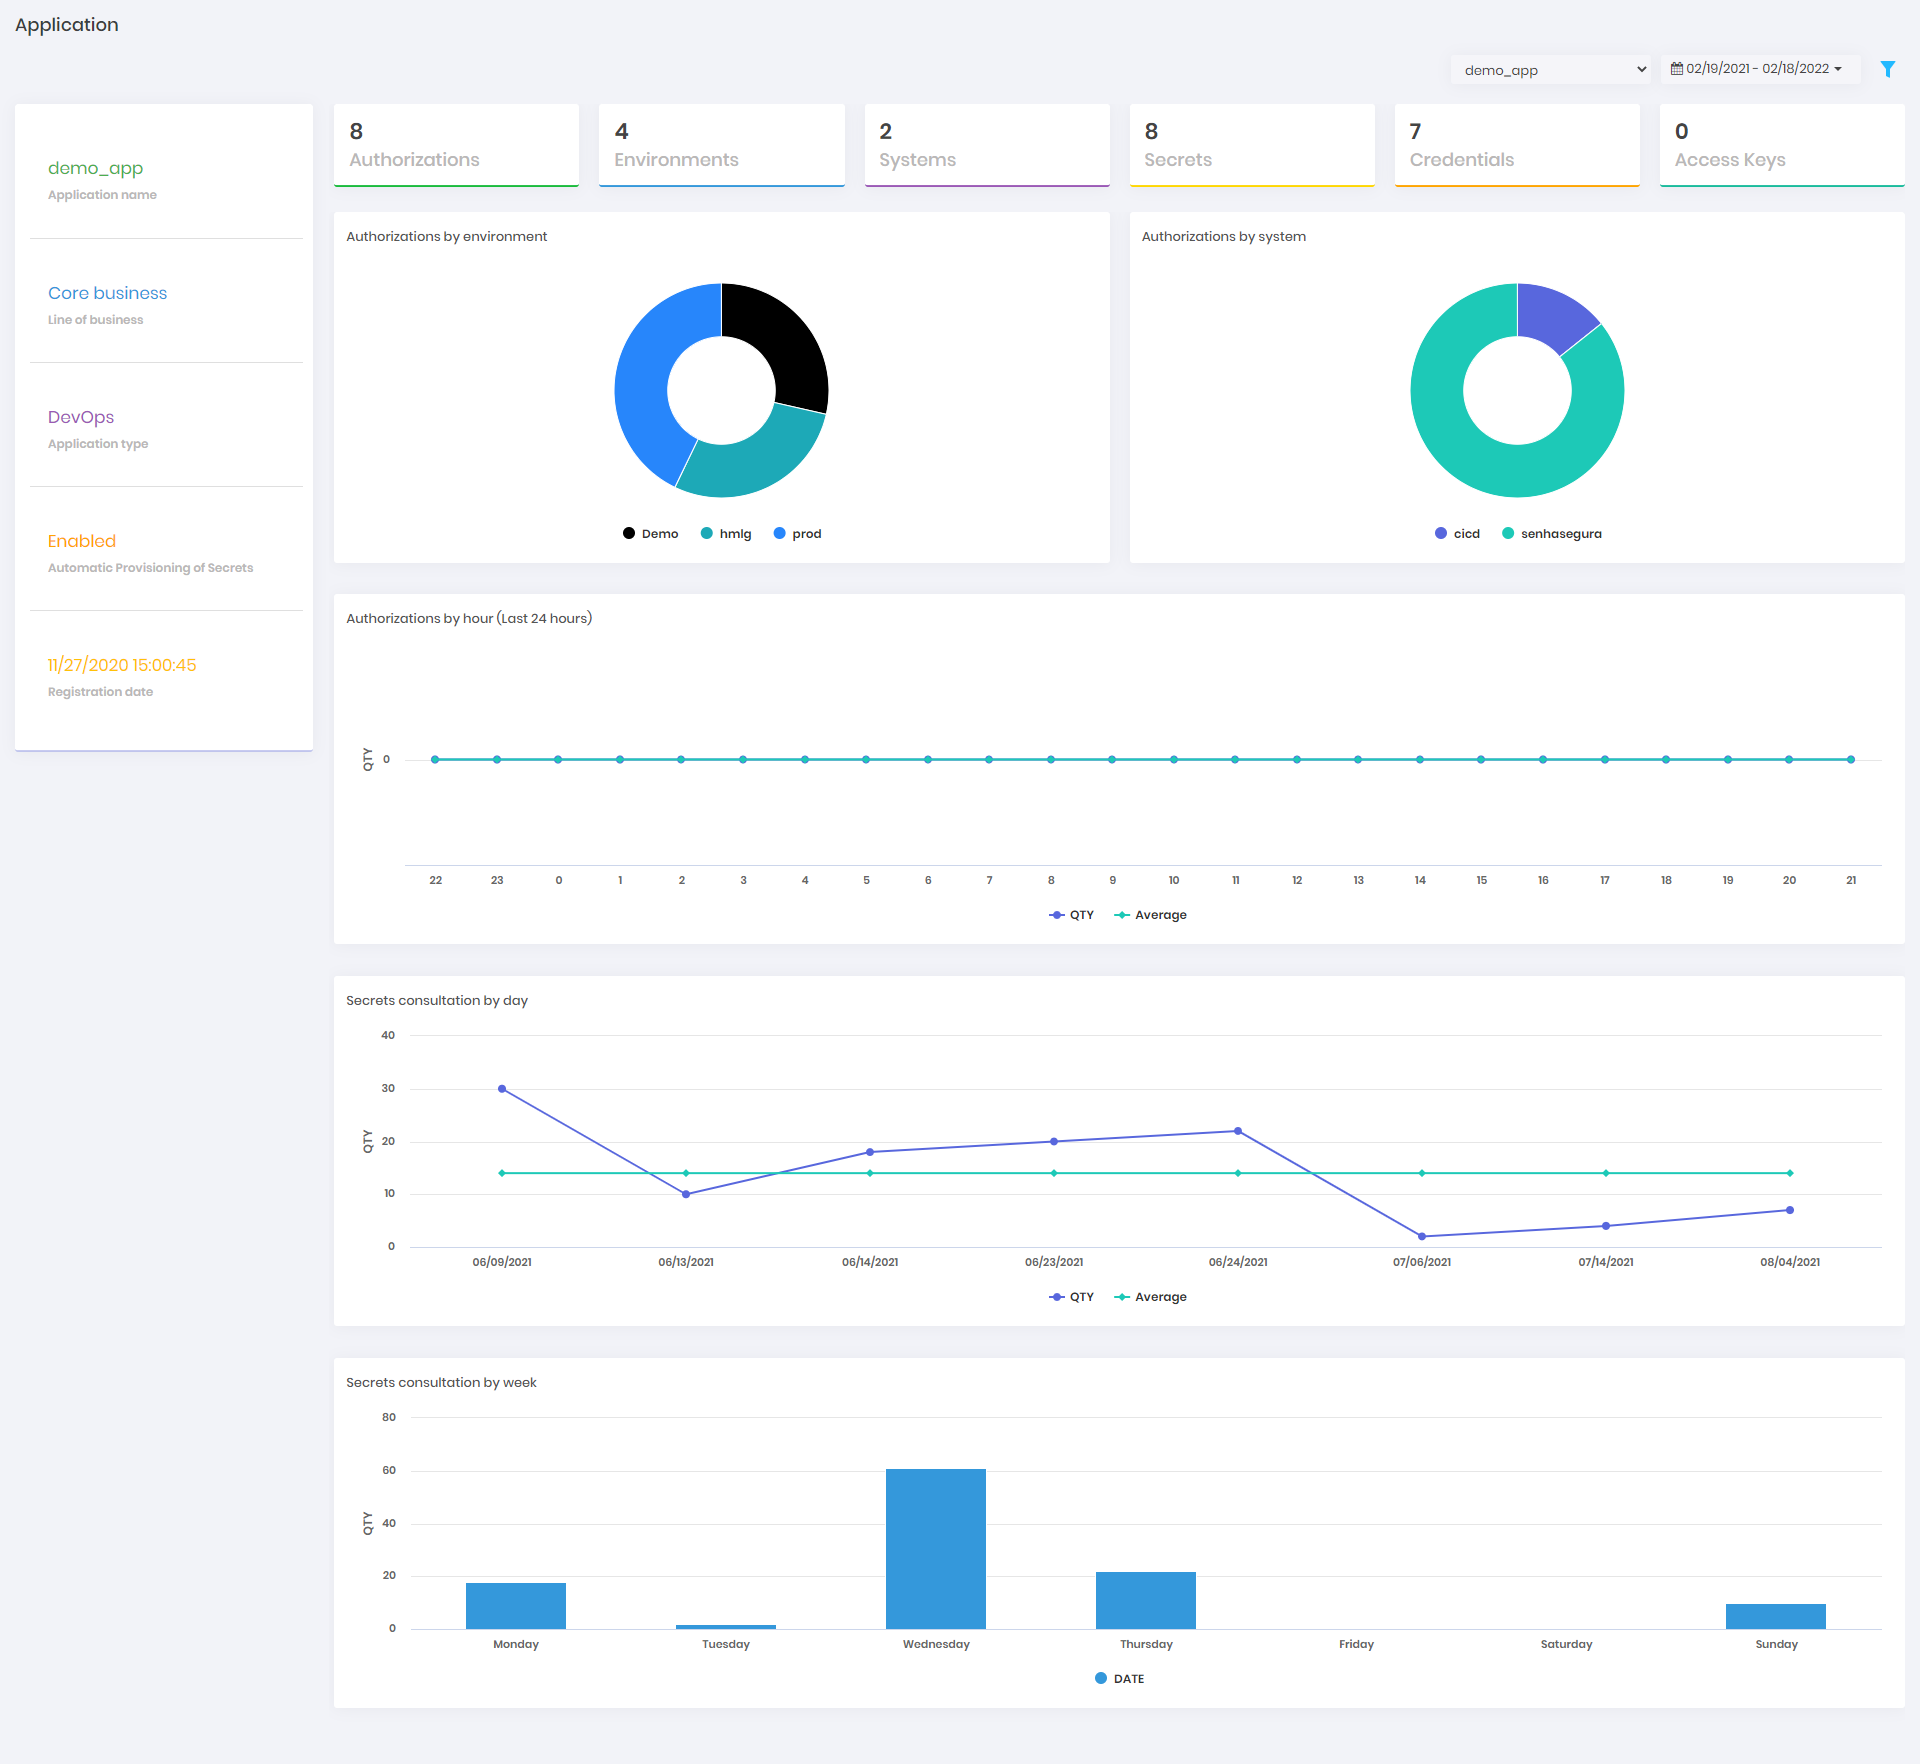
| Application name | Name of the application according to the applied filter. |
| Line of business | It is the Name of the Application's Line of business. |
| Application type | Type of the application. |
| Automatic Provisioning of Secrets | It indicates if the application has Dynamic Provisioning enabled or not. |
| Registration date | Date and time of the application creation in DSM. |
| Authorizations | Number of the active authorizations. This information is not affected by data filter. |
| Environments | Number of the active enviornments related to the application. This information is not affected by data filter. |
| Systems | Number of the active systems related to the application. This information is not affected by data filter. |
| Secrets | Number of the active secrets related to the application. This information is not affected by data filter. |
| Credentials | Number of the active credentials related to the application's secrets. This information is not affected by data filter. |
| Access Keys | Number of the active cloud access keys related to the application's secrets. This information is not affected by data filter. |
| Authorizations by environment | A pie chart with the number of the authorizations by environment. This chart is affected by data filter. |
| Authorizations by system | A pie chart with the number of the authorizations by system. This chart is affected by data filter. |
| Authorizations by hour (Last 24 hours) | A bar chart with the number of the authorizations created per hour in the last 24 hours. This chart is affected by data filter. |
| Secrets consultation by day | A line chart with the number of the secrets consultations by day. This chart is affected by data filter. |
| Secrets consultation by week | A bar chart with the number of the secrets consultations by the days of the week. This chart is affected by data filter. |
tip
You can click on the boxes or charts to open the filtered report.