Secret Management
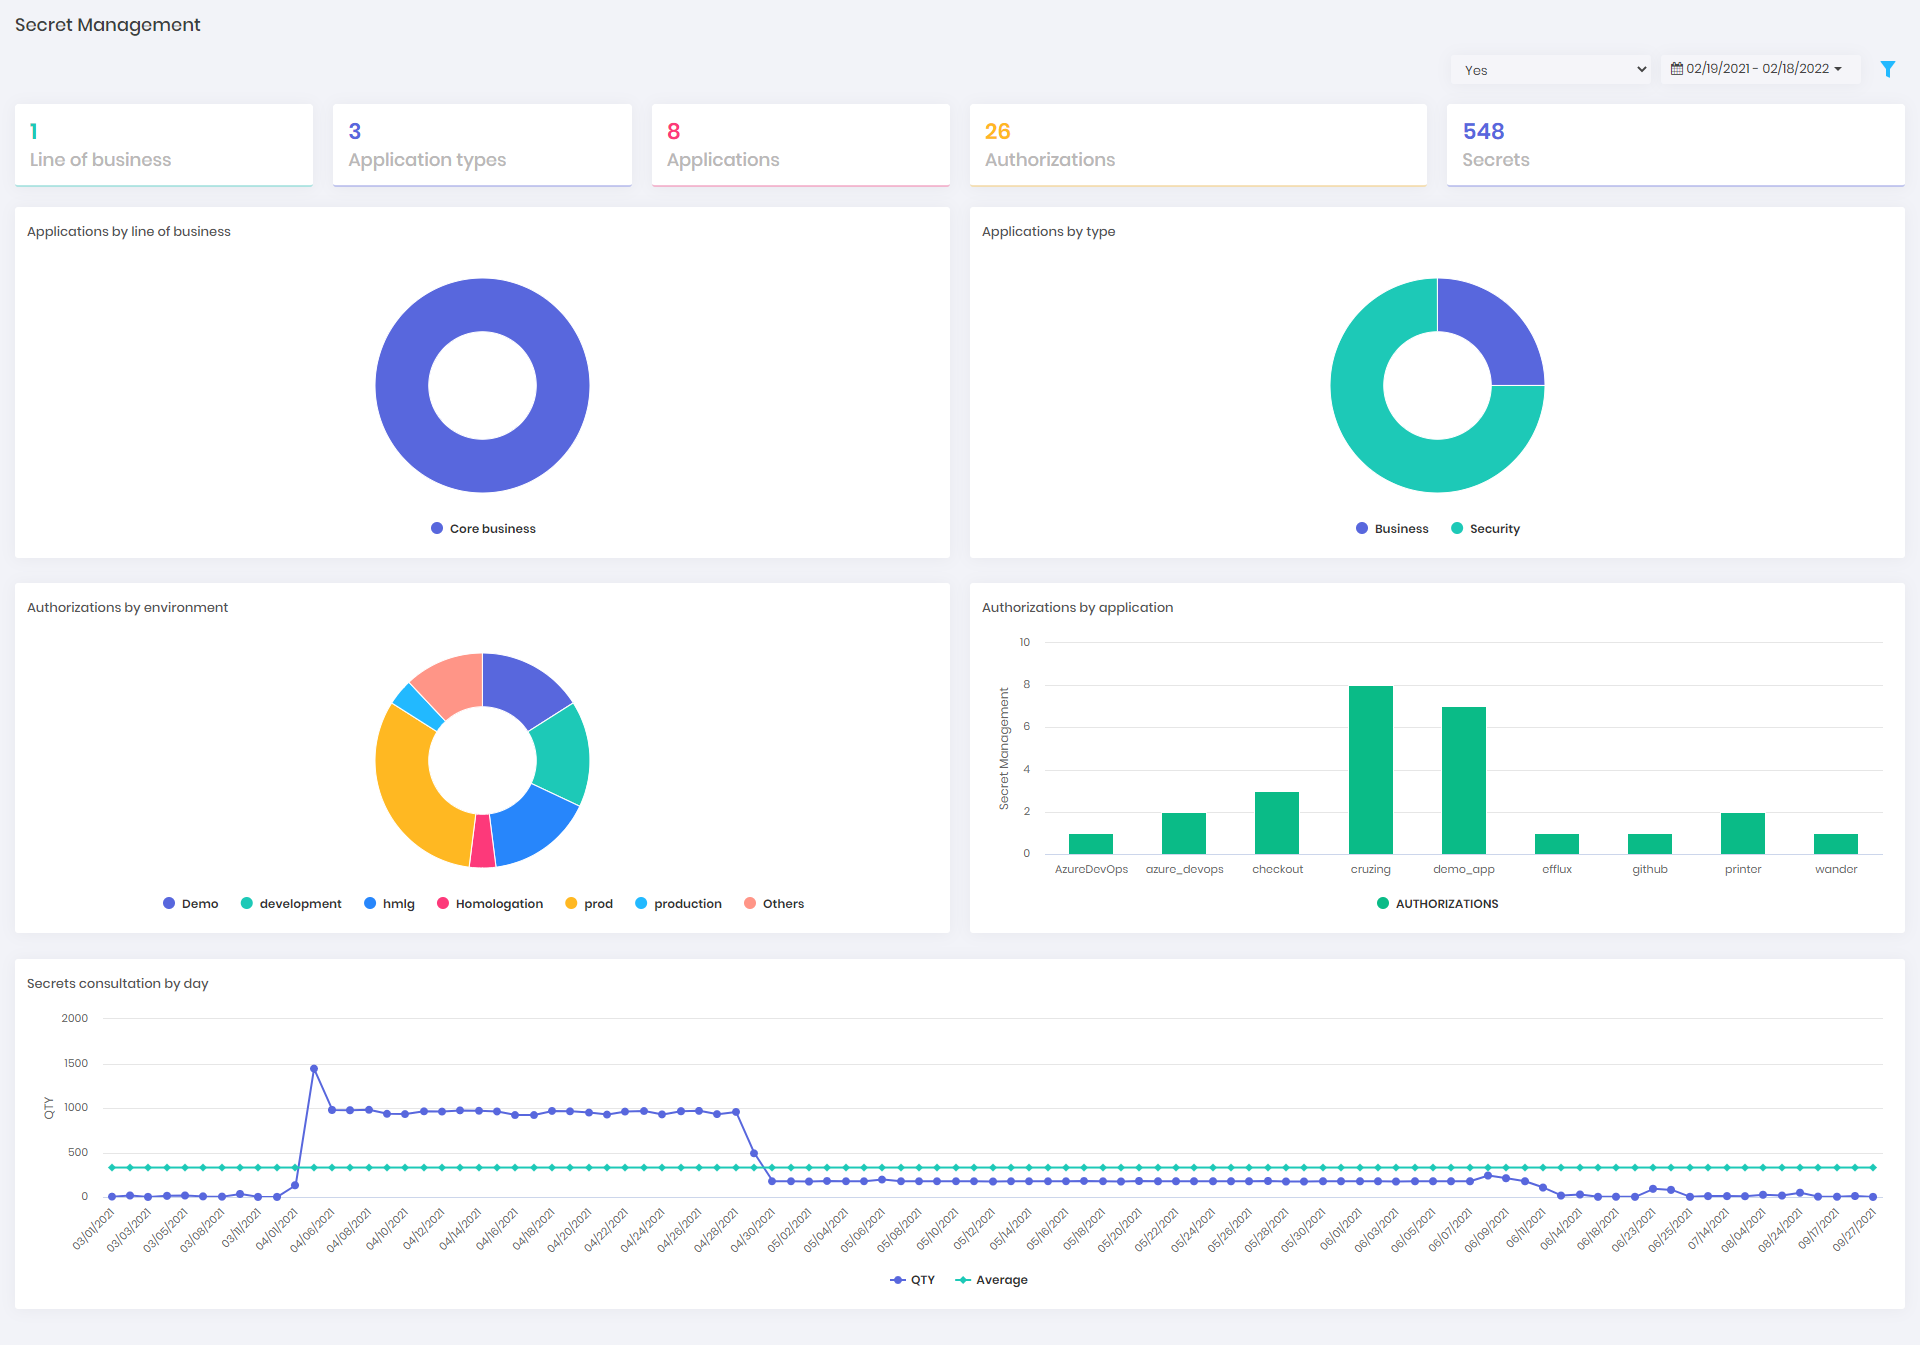
You will see, in this dashoboard, general information about applications and secrets managed by the DSM.
You can filter some information by status or data interval.
Access this dashboard in DSM ➔ Dashboards ➔ Secret Management.

The following information is available in this dashboard:
| Information | Description |
|---|---|
| Line of business | Total of Line of business. The available option is Core business. This information is not affected by dashboard filters. |
| Application types | Total of Application types. The available options are Business, DevOps, and Security. This information is not affected by dashboard filters. |
| Applications | Applications created in the period and are enabled now. This information is affected by dashboard filters. |
| Authorizations | Authorizations created in the period and are enabled now. This information is affected by dashboard filters. |
| Secrets | Secrets created in the period and are enabled now. This information is affected by dashboard filters. |
| Applications by line of business | A pie chart with the number of applications by line of business. This chart is affected by dashboard filters. |
| Applications by type | A pie chart with the number of applications by line of business. This chart is affected by dashboard filters. |
| Authorizations by environment | A pie chart with the number of authorizations by environment. This chart is affected by dashboard filters. |
| Authorizations by application | A bar chart with the number of authorizations by application. This chart is affected by dashboard filters. |
| Secrets consultation by day | A line chart with the number of consulting of secrets. This chart is affected by dashboard filters. |
tip
You can click on the boxes or charts to open the filtered report.